Parsing the Impacts of Climate Change from Rate Increases on Recent High LADWP Electricity Bills
Base rate adjustments alone do not explain recent bill increases.
Key Takeaways
- Analysis of detailed weather data for the City of Los Angeles shows that the accumulation of Cooling Degree Days this past Aug-Oct outpaced all available historical analogs – making 2026 the hottest summer in LA over the past 77 years (at least).
- Modeling a representative set of LADWP residential customer archetypes, we find that weather-driven cooling demand and progressive tier escalation were likely the primary drivers of year over year customer bill increases (75.5% to 88.4%)
- By comparison, LADWP’s year over year residential rate tariff increases were found to only have a marginal effect on modeled bill changes (11.6 to 20.5%).
- Based upon these results, we must acknowledge the essential role that the city’s changing climate and its aging, poorly-insulated, residential building stock play in contributing to customer energy burdens.
- Moving forward, both the City of Los Angeles and the LADWP should adopt a more comprehensive approach to managing customer bill impacts from the experience of increasingly severe summer heat that addresses structural inadequacies of the existing building stock.
Introduction
Over the past several weeks, thousands of LADWP customers have reported anomalously high electricity bills for billing periods spanning the months of August to October 2026. These complaints have triggered widespread calls for independent audits of LADWP operations and billing practices. While retail volumetric tariffs increased modestly over the past year, municipal base rate adjustments do not explain the bill increases alone. Instead, we have found that the experience of sustained, and largely unprecedented, extreme heat during this period most likely constituted the primary driver of customer bill increases.
In this report, we evaluate daily 4 km gridded meteorological observations from the Oregon State University PRISM Climate Group for the City of Los Angeles over a continuous 77-year historical baseline (1950–2026). We analyze the magnitude and spatial distribution of extreme heat conditions experienced from August 1 through October 31, 2026. Specifically, we quantify daily Cooling Degree Days (65) and compound diurnal thermal metrics for 120 grid cell locations throughout the city, relative to neighborhood boundaries established by the LA Times.
Background
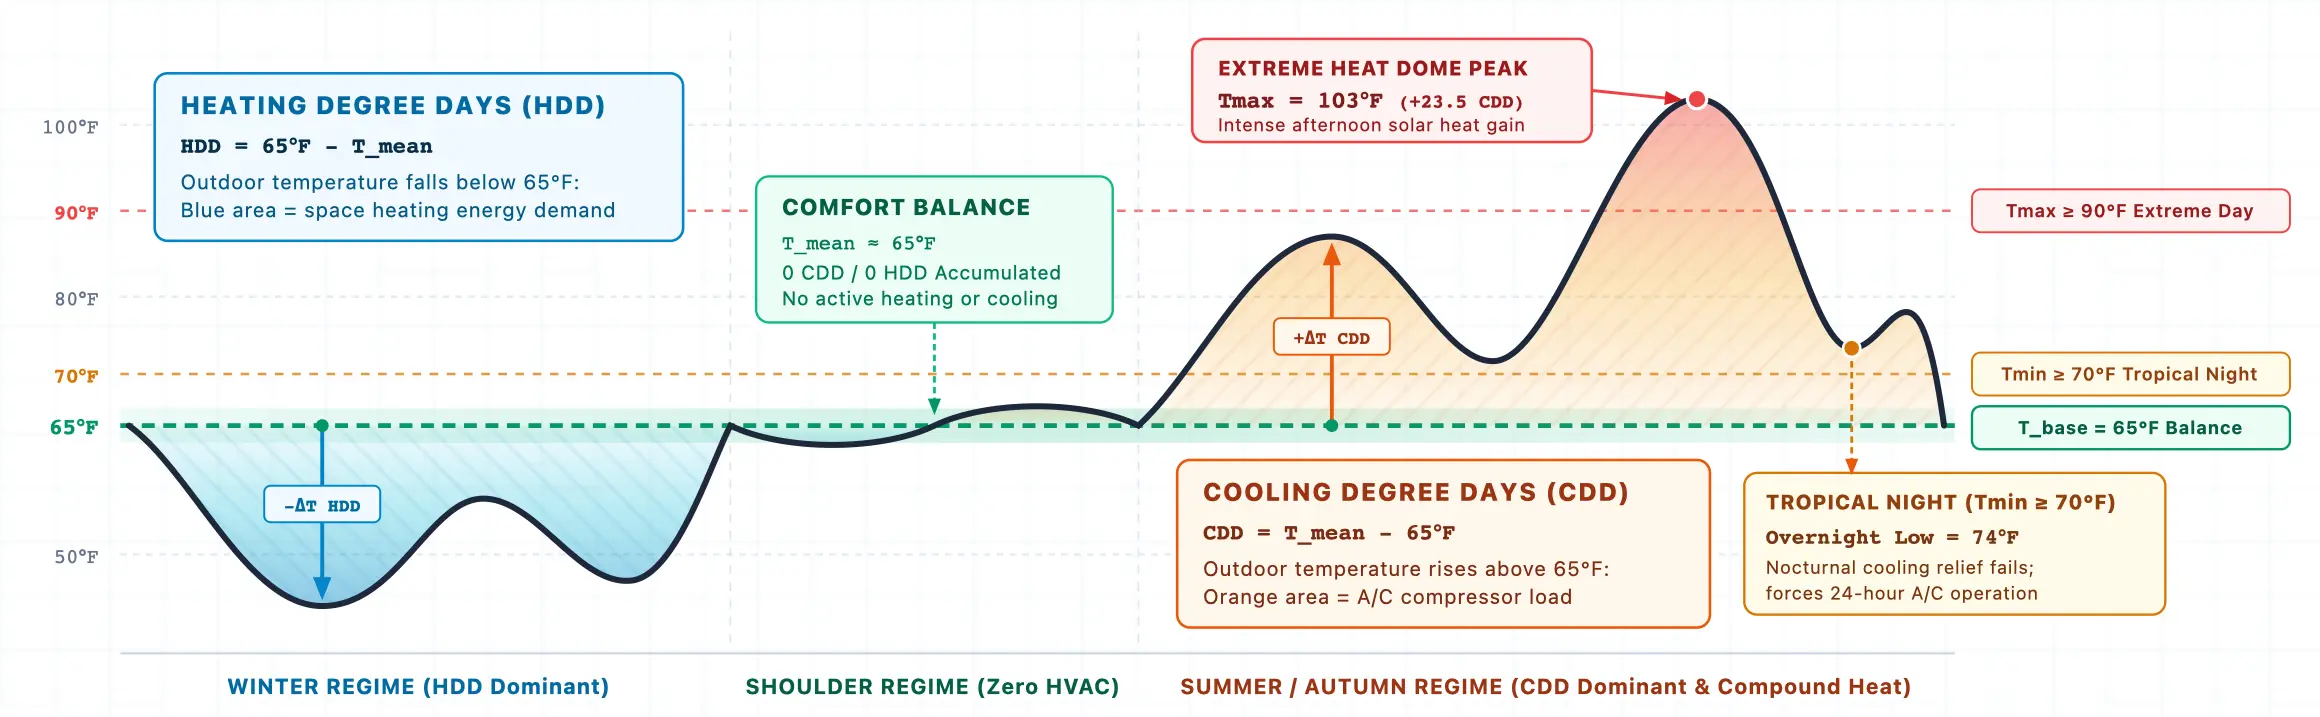
Applied climatologists and building energy analysts quantify weather-driven air conditioning demand using a set of metrics called Cooling and Heating Degree Days ( & ). Despite what the names may suggest, these degree day metrics do not purely represent a count of days in which mechanical heating or cooling was likely necessary. The metrics provide a measure of the extent to which thermal stress on buildings and their mechanical climate control systems accumulates over time. The larger the or value, the greater the estimated stress on either heating systems (in the case of ) or cooling systems (in the case of ). This stress is calculated relative to some baseline temperature at which it is assumed that neither heating nor cooling is necessary, typically (base ). As shown in Figure 1 below, over the course of a year, temperatures falling below 65°F induce space heating related energy demand (blue area), moderate shoulder conditions require zero mechanical conditioning, and warm periods above 65°F drive electricity consumption to power mechanical air conditioning systems (orange area).
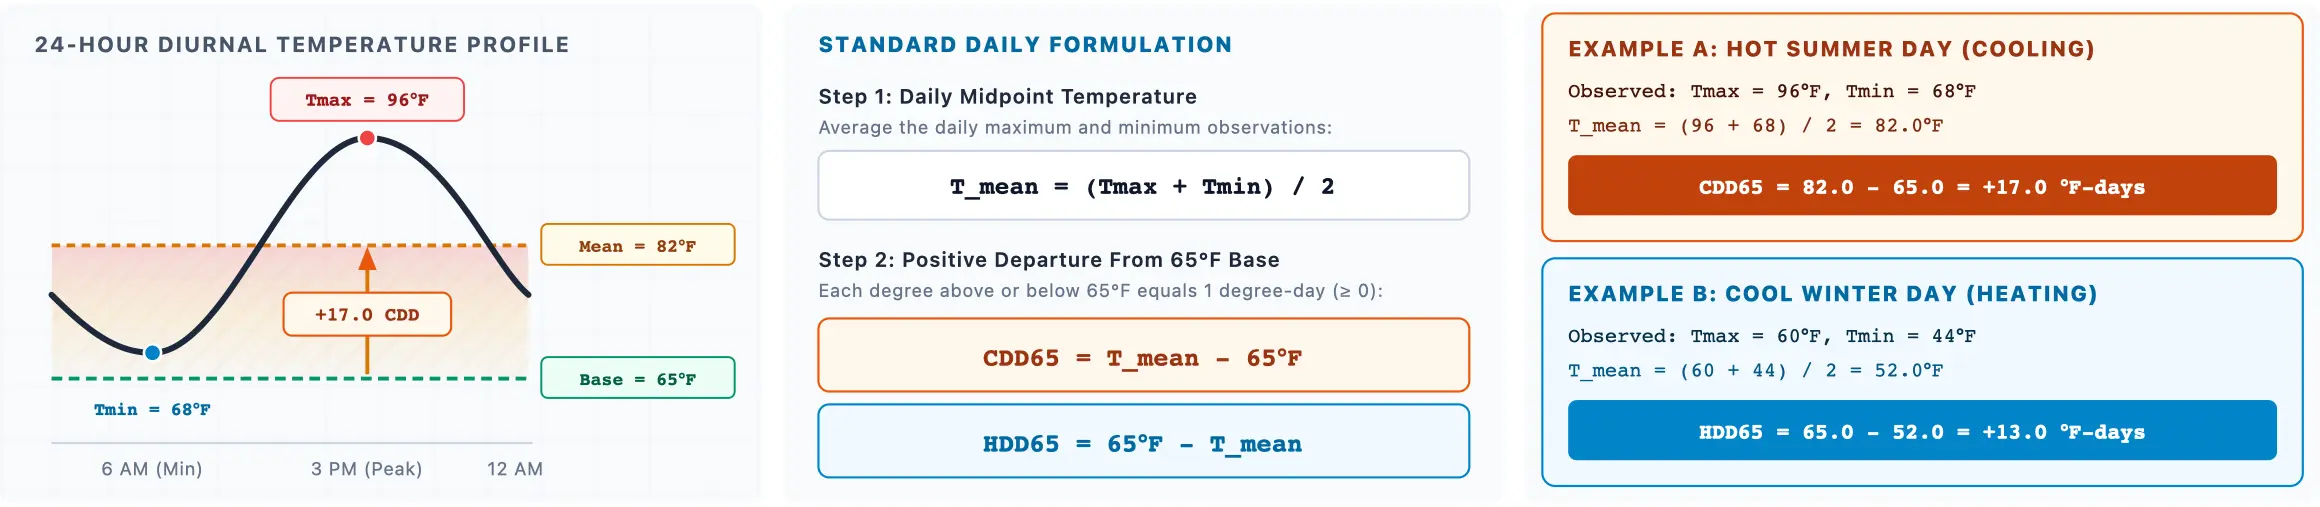
At the daily scale, high-resolution gridded meteorological data allow the direct calculation of degree days from 24-hour observations. A degree day calculation utilizes daily mean temperatures (Tmean), which are calculated as the midpoint between daily maximum (Tmax) and minimum (Tmin) temperatures. As illustrated in Figure 2, each degree by which mean exceeds 65°F represents one Cooling Degree Day (CDD65). Conversely, each degree below 65°F constitutes one Heating Degree Day (HDD65). As a basic example, if you had monthlong period (31 days) where every day’s average temperature was 10 degrees above the baseline (65°F), then the total number of Cooling Degree Days experienced during that time would be: +10°F * 31 days = +310 CDD (or +310 °F-days). By combining the magnitude of the differences between the observed mean temperatures and the established baseline with the number of days each temperature disparity occurred, the CDD measure serves as an indicator of the estimated severity of the stress on mechanical cooling systems.
Climate Analysis
Based upon our analysis, across the City of Los Angeles, the area-weighted mean number of Cooling Degree Days for the period spanning from August–October of 2026 (92 days) totaled 877.0 CDD. As illustrated in Figure 3, 2026 marked the single hottest August–October season in the entire 77-year PRISM observational record (1950–2026) eclipsing other historic benchmark years including 2015 (860.5 CDD), 2020 (840.0 CDD), 2022 (791.8 CDD), and 1997 (755.1 CDD). Relative to the 1991–2020 NOAA climatological normal (587.3 CDD), this year’s heat conditions were +49.3% above the baseline (+289.7 CDD).
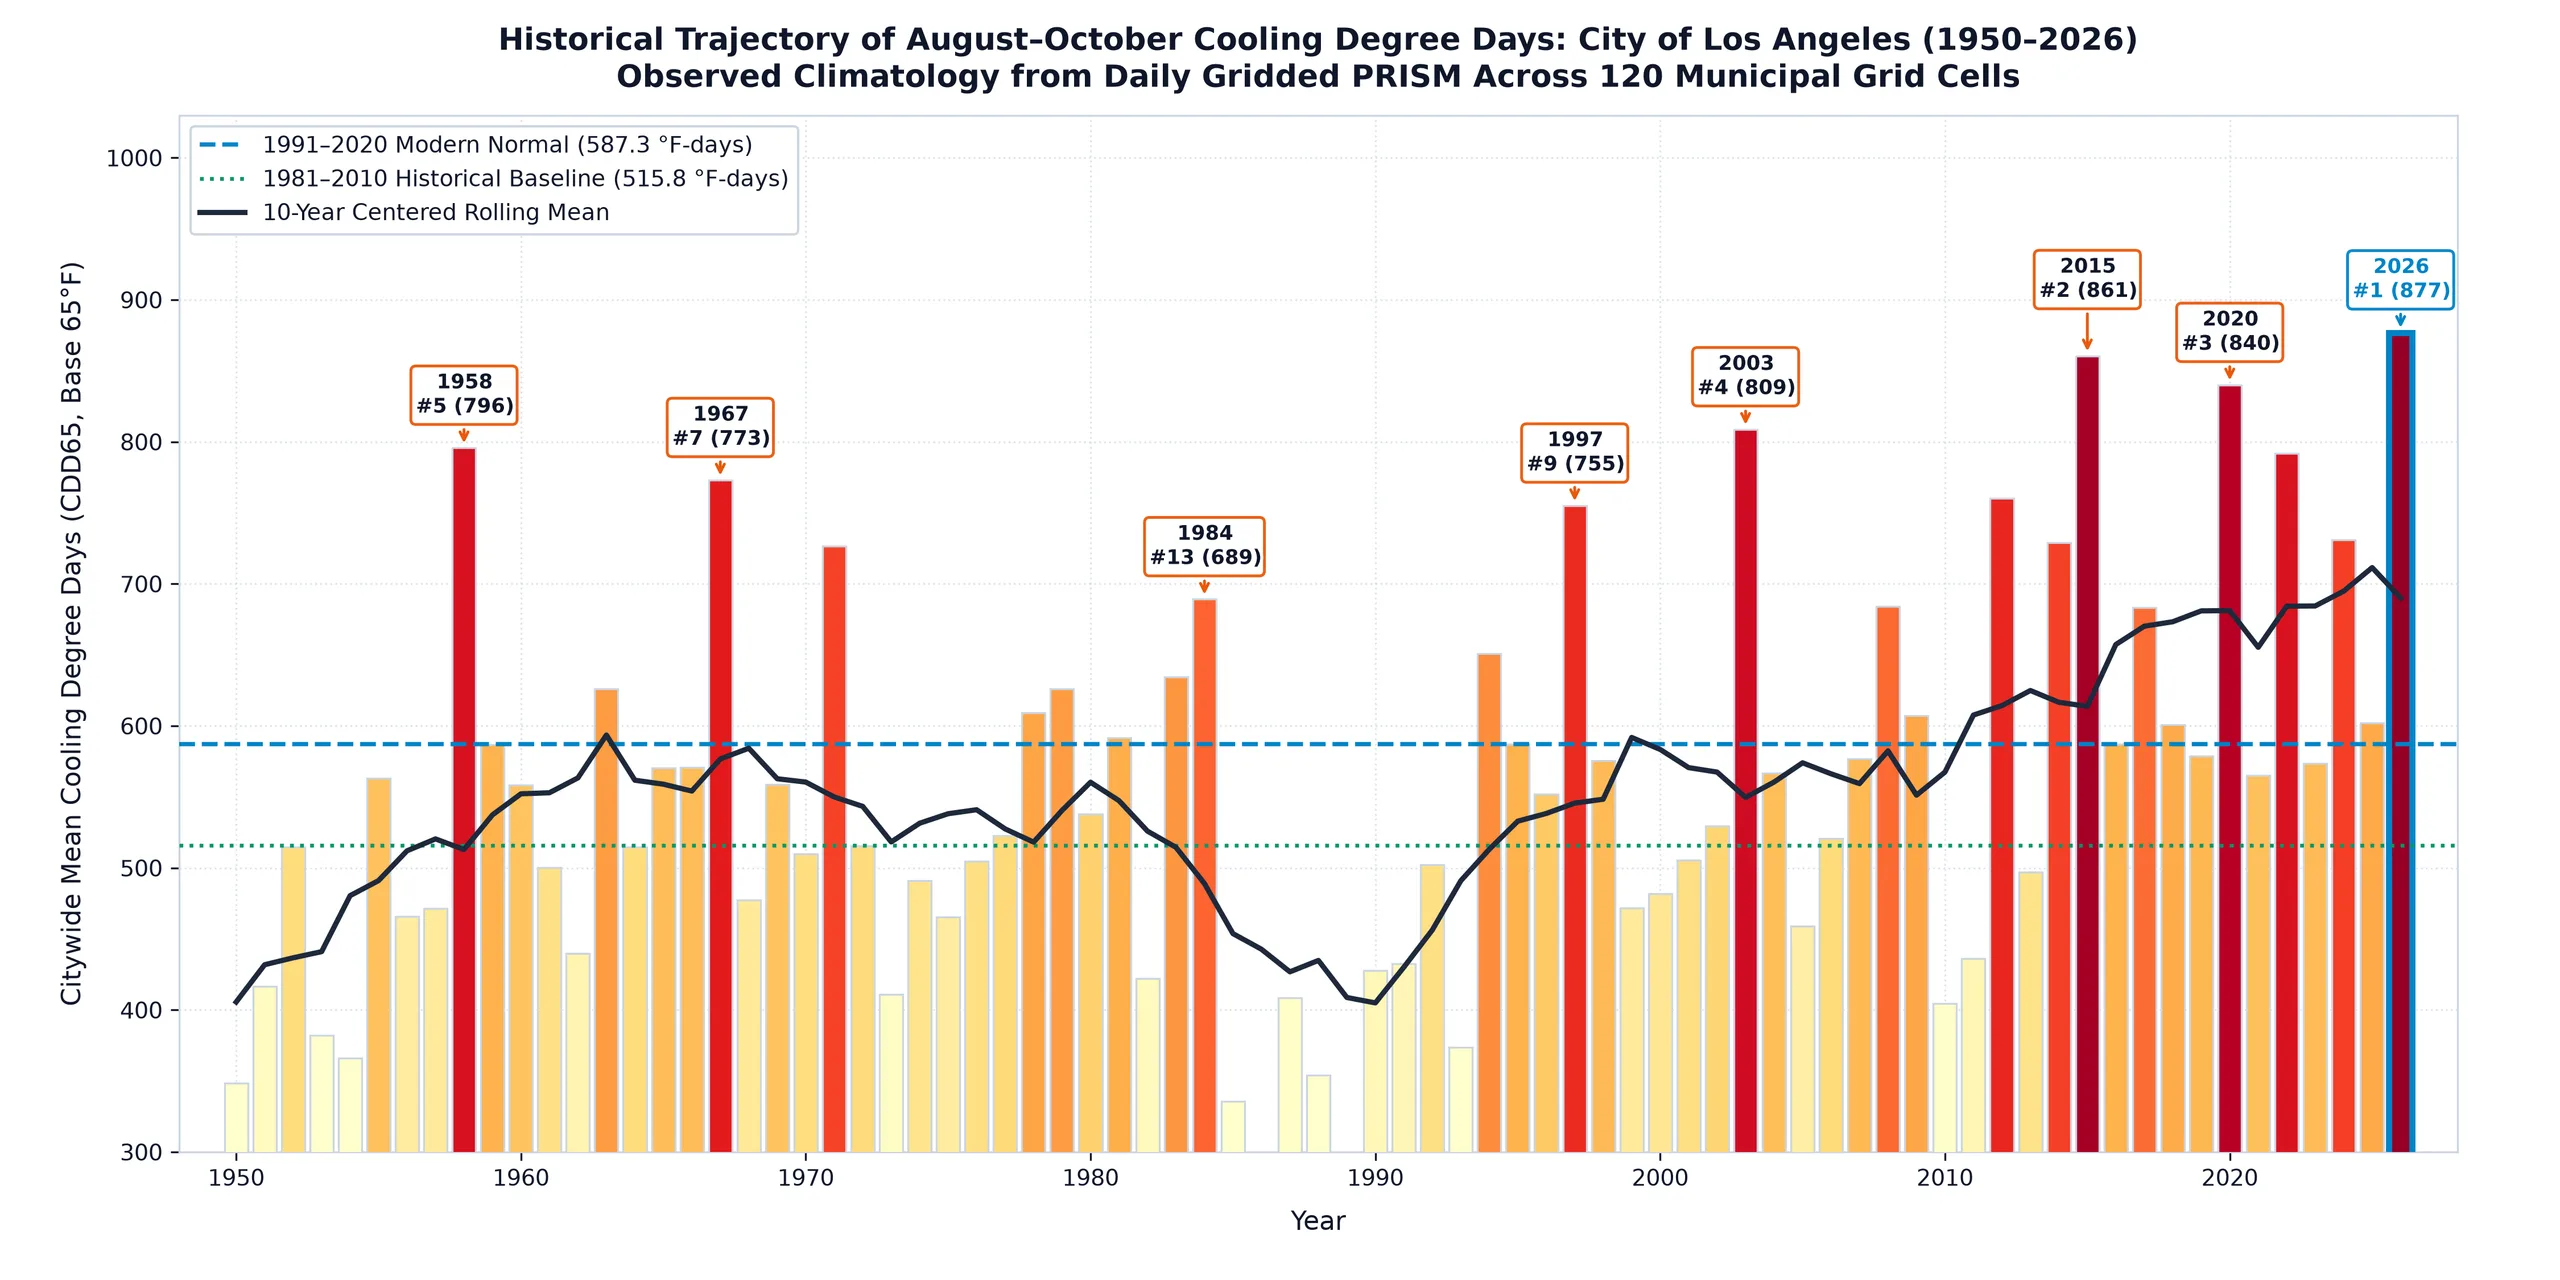
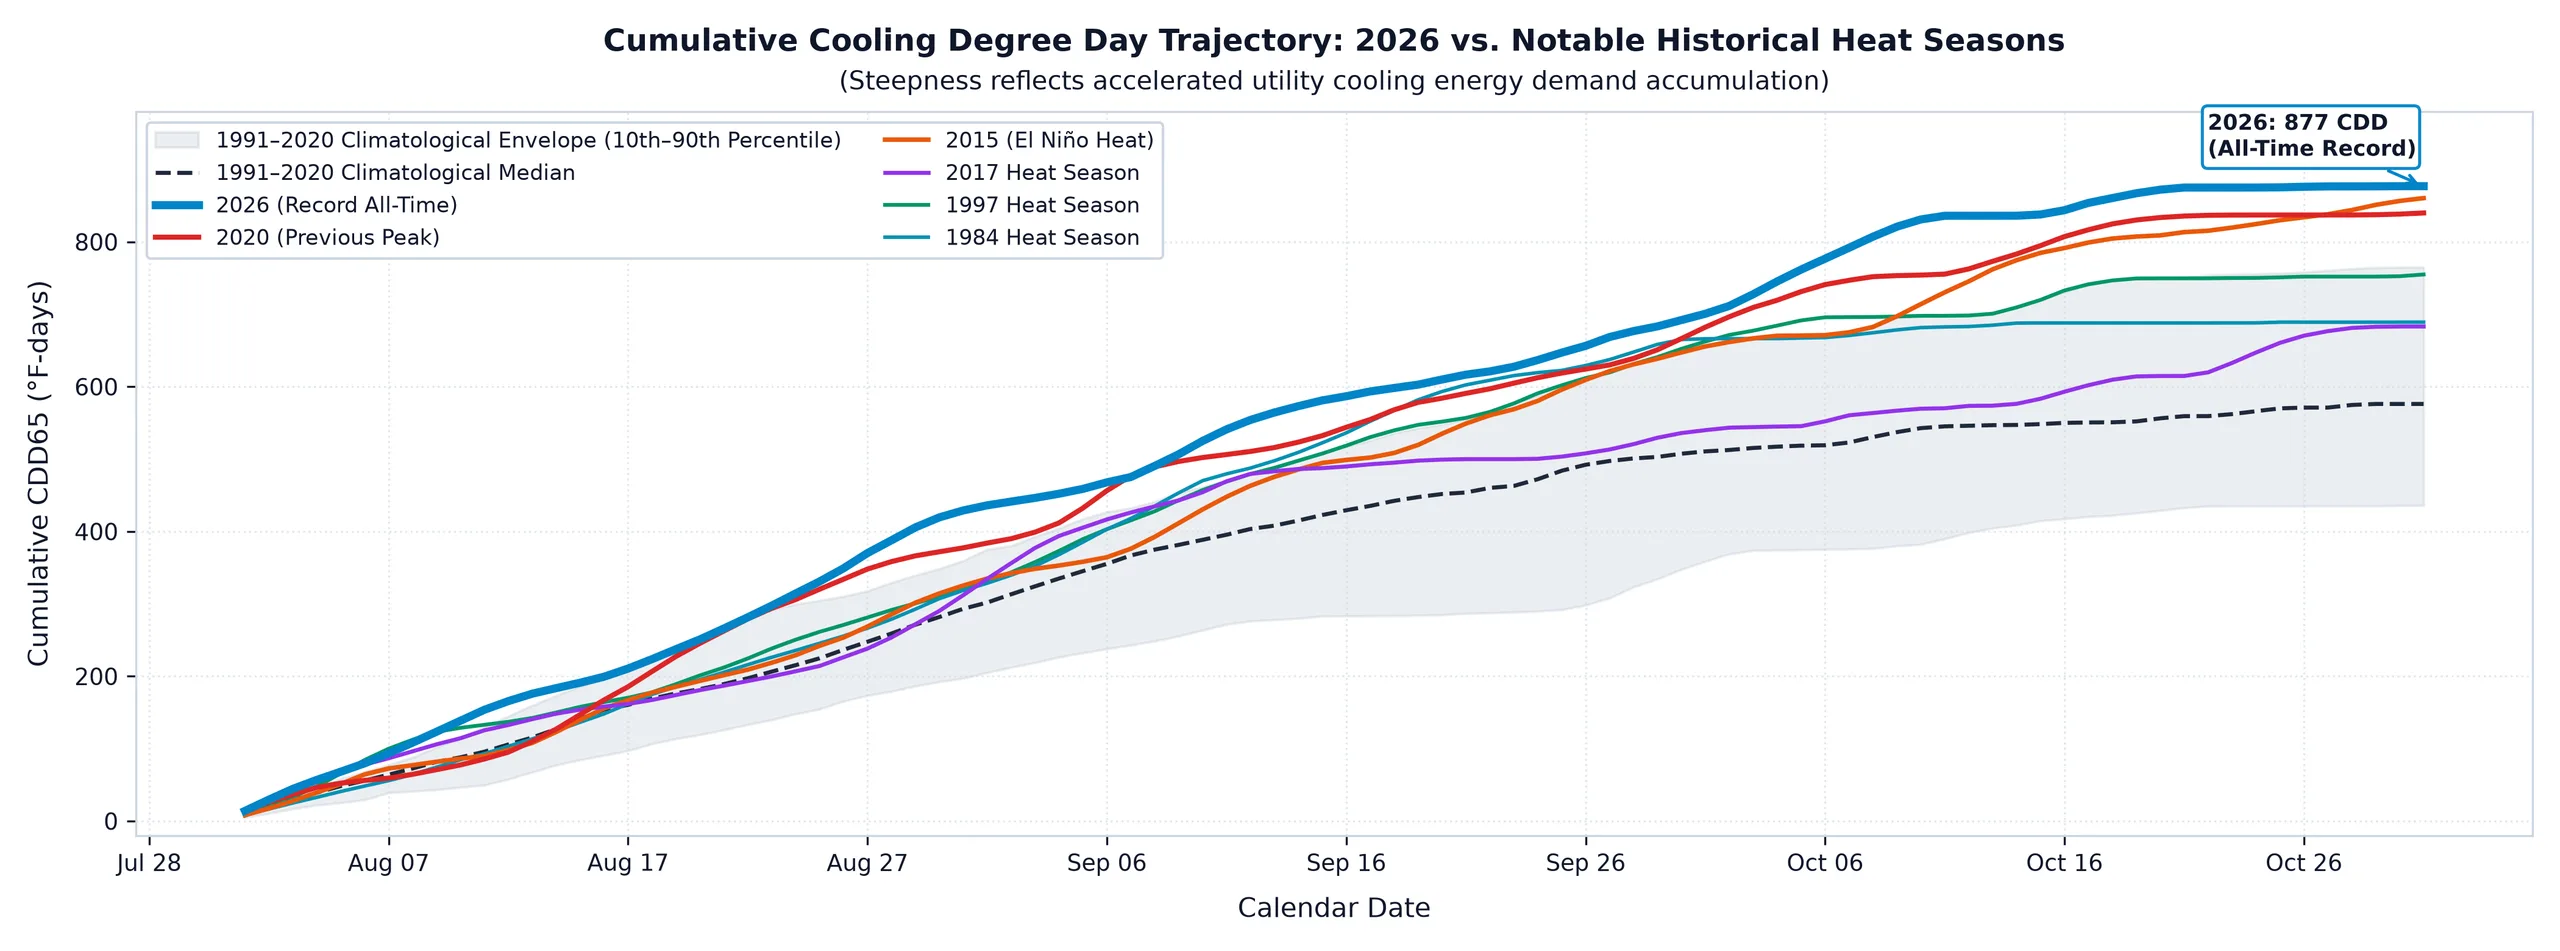
Figure 4 illustrates how the accumulation of Cooling Degree Days over this three-month period in 2026 outpaced historical analogs. The slope of cumulative 65 curves reflect the pace of accumulation of electricity demand for cooling throughout the entire city. Beginning in mid-August, repeated heatwaves propelled 2026 cumulative degree days above the 90th percentile envelope of the 1991–2020 baseline. The trajectory surpassed the previous 2020 benchmark by early September. A severe early-October heatwave subsequently established the all-time record of 877.0 CDD.
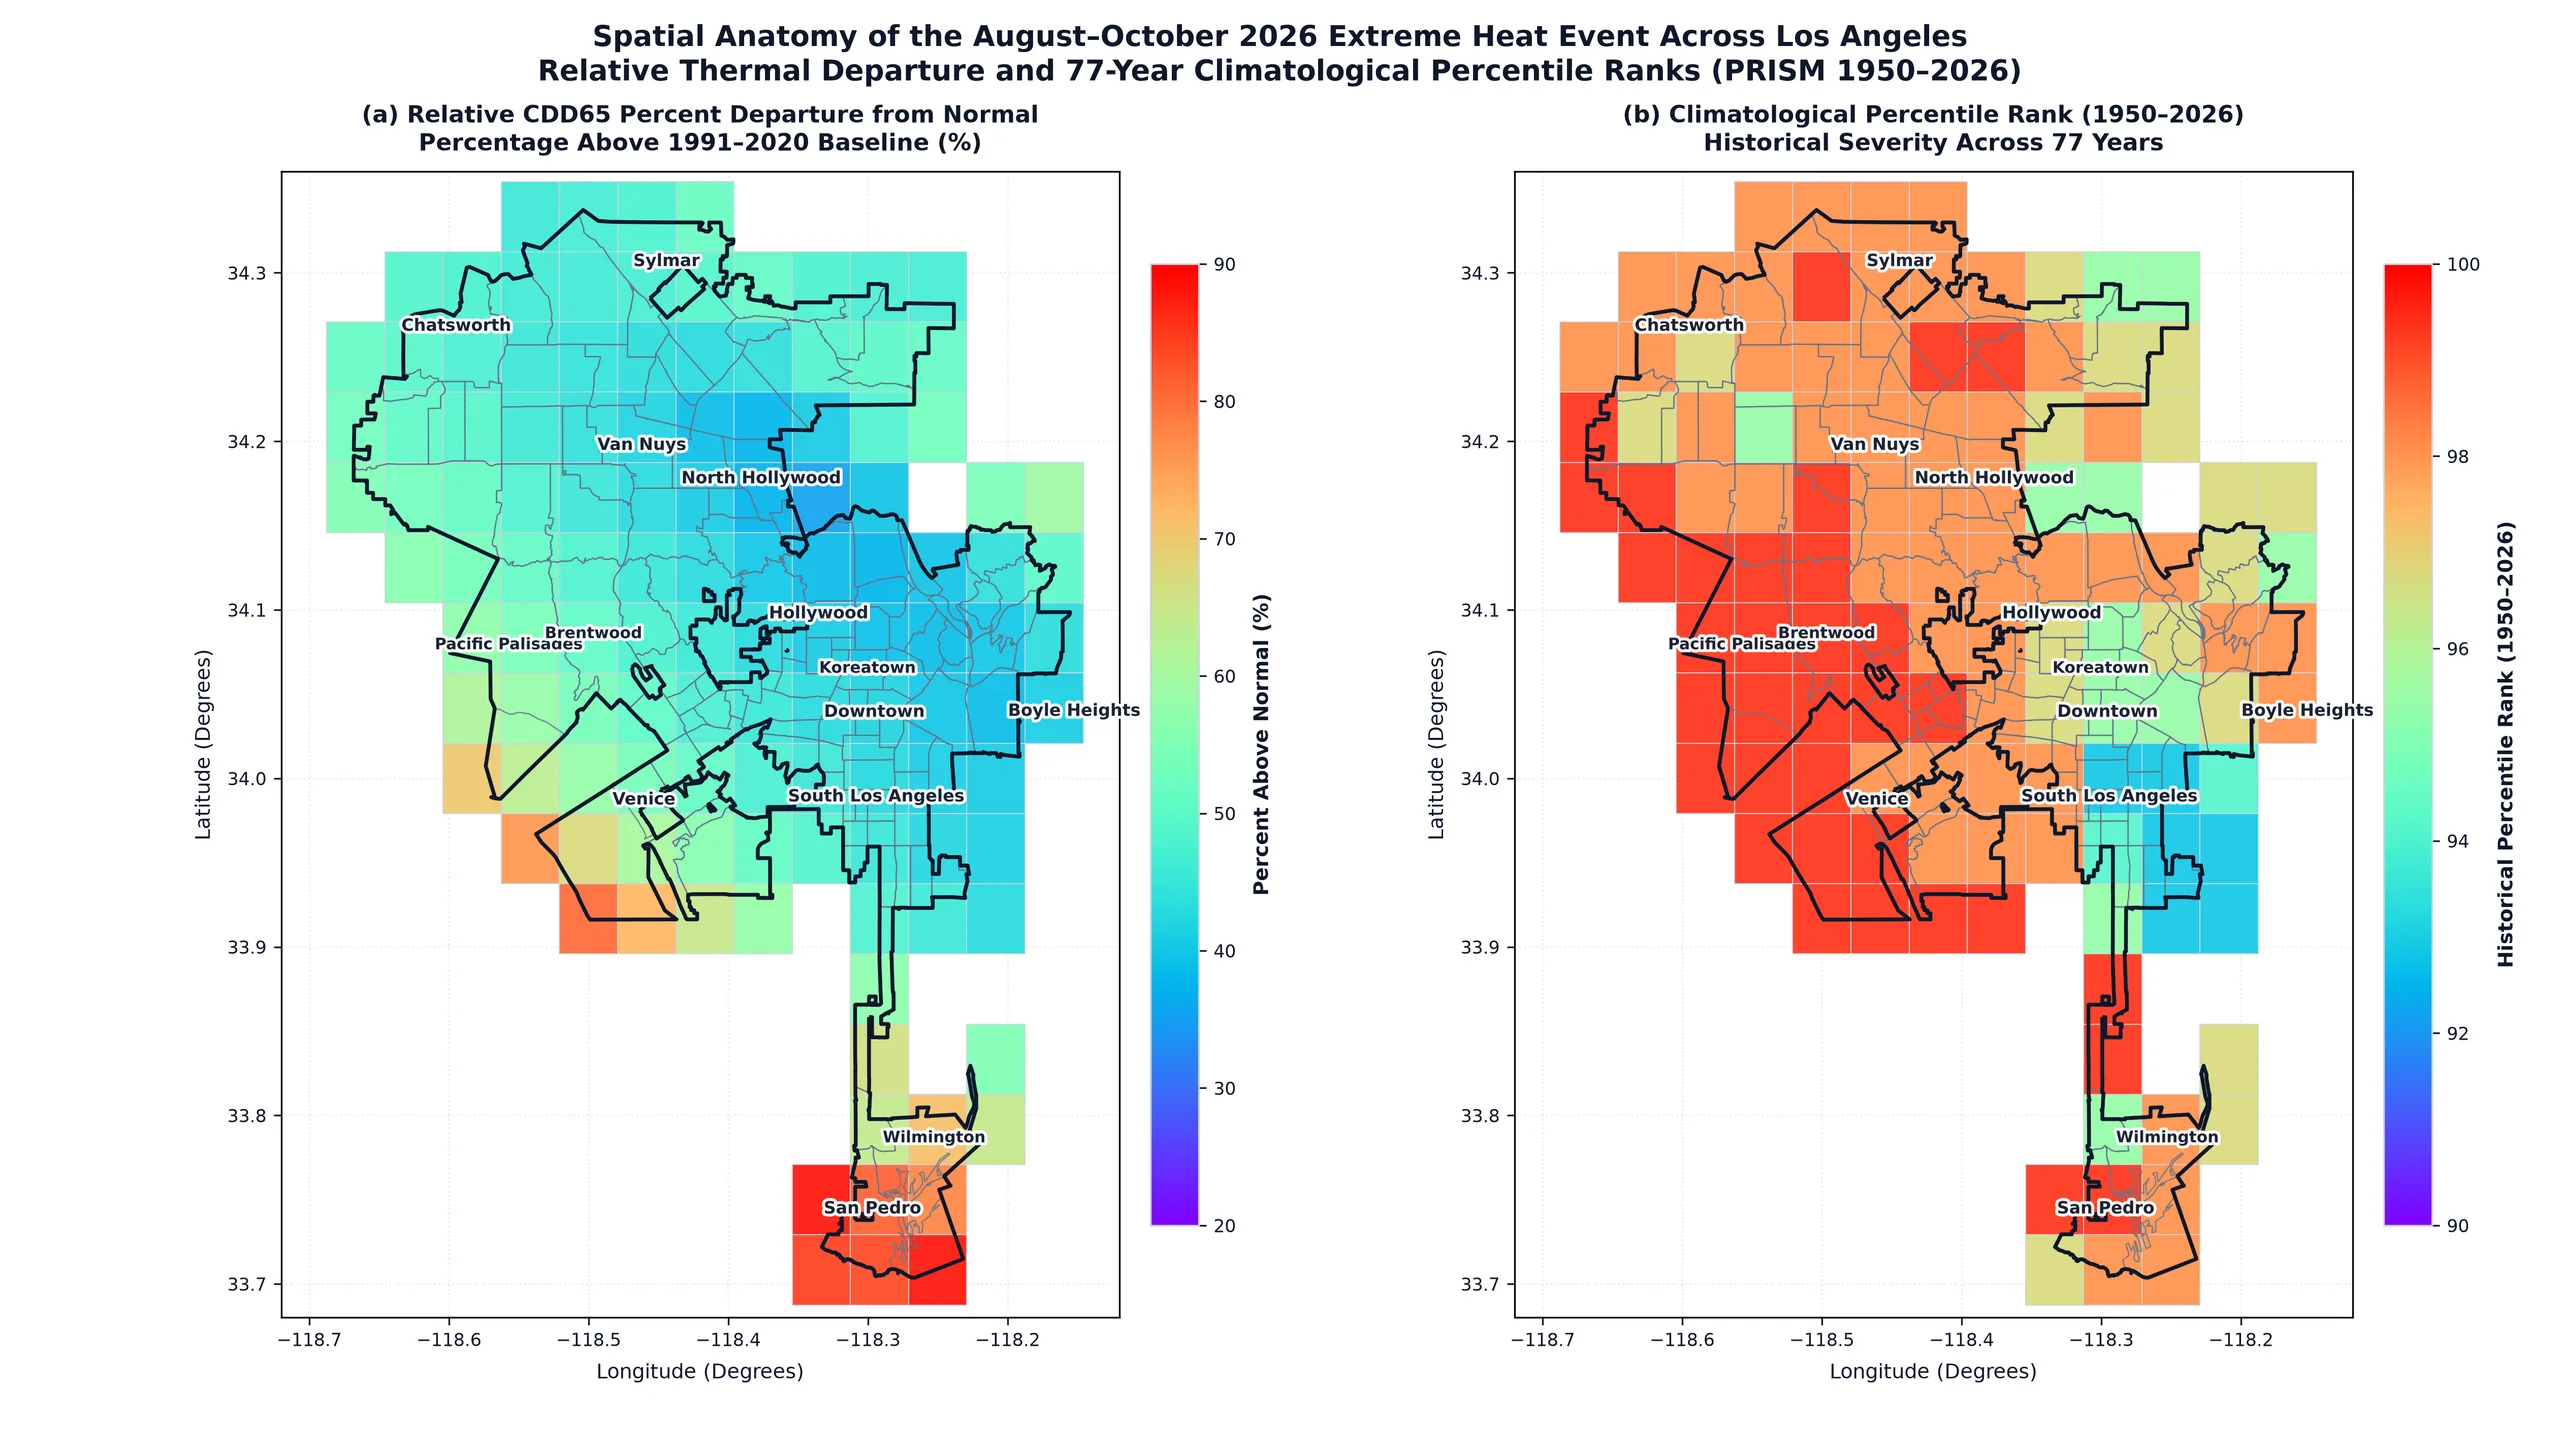
Due to local topography and the moderating effects of cool ocean air, Los Angeles exhibits a pronounced inland-to-coastal gradient in terms of the levels of thermal stress encountered by its utility customers. As depicted by the map to the left of Figure 5, communities in the San Fernando Valley were among the most severely impacted over the most recent August – October period, averaging 936.2 CDD (+45.7% above normal), with local microclimates peaking at 1,193.5 CDD. In contrast, coastal and harbor regions experienced the benefits of marine buffering, with Harbor neighborhoods averaging 714.9 CDD. Overall, inland-valley communities experienced a 1.81x average increase in the number of accumulated Cooling Degree Days compared to their coastal counterparts. Yet despite these differences, as shown in the map to the right of Figure 5, many of the city’s coastal neighborhoods still experienced their hottest ever (100th percentile) summer season over the past 77 years.
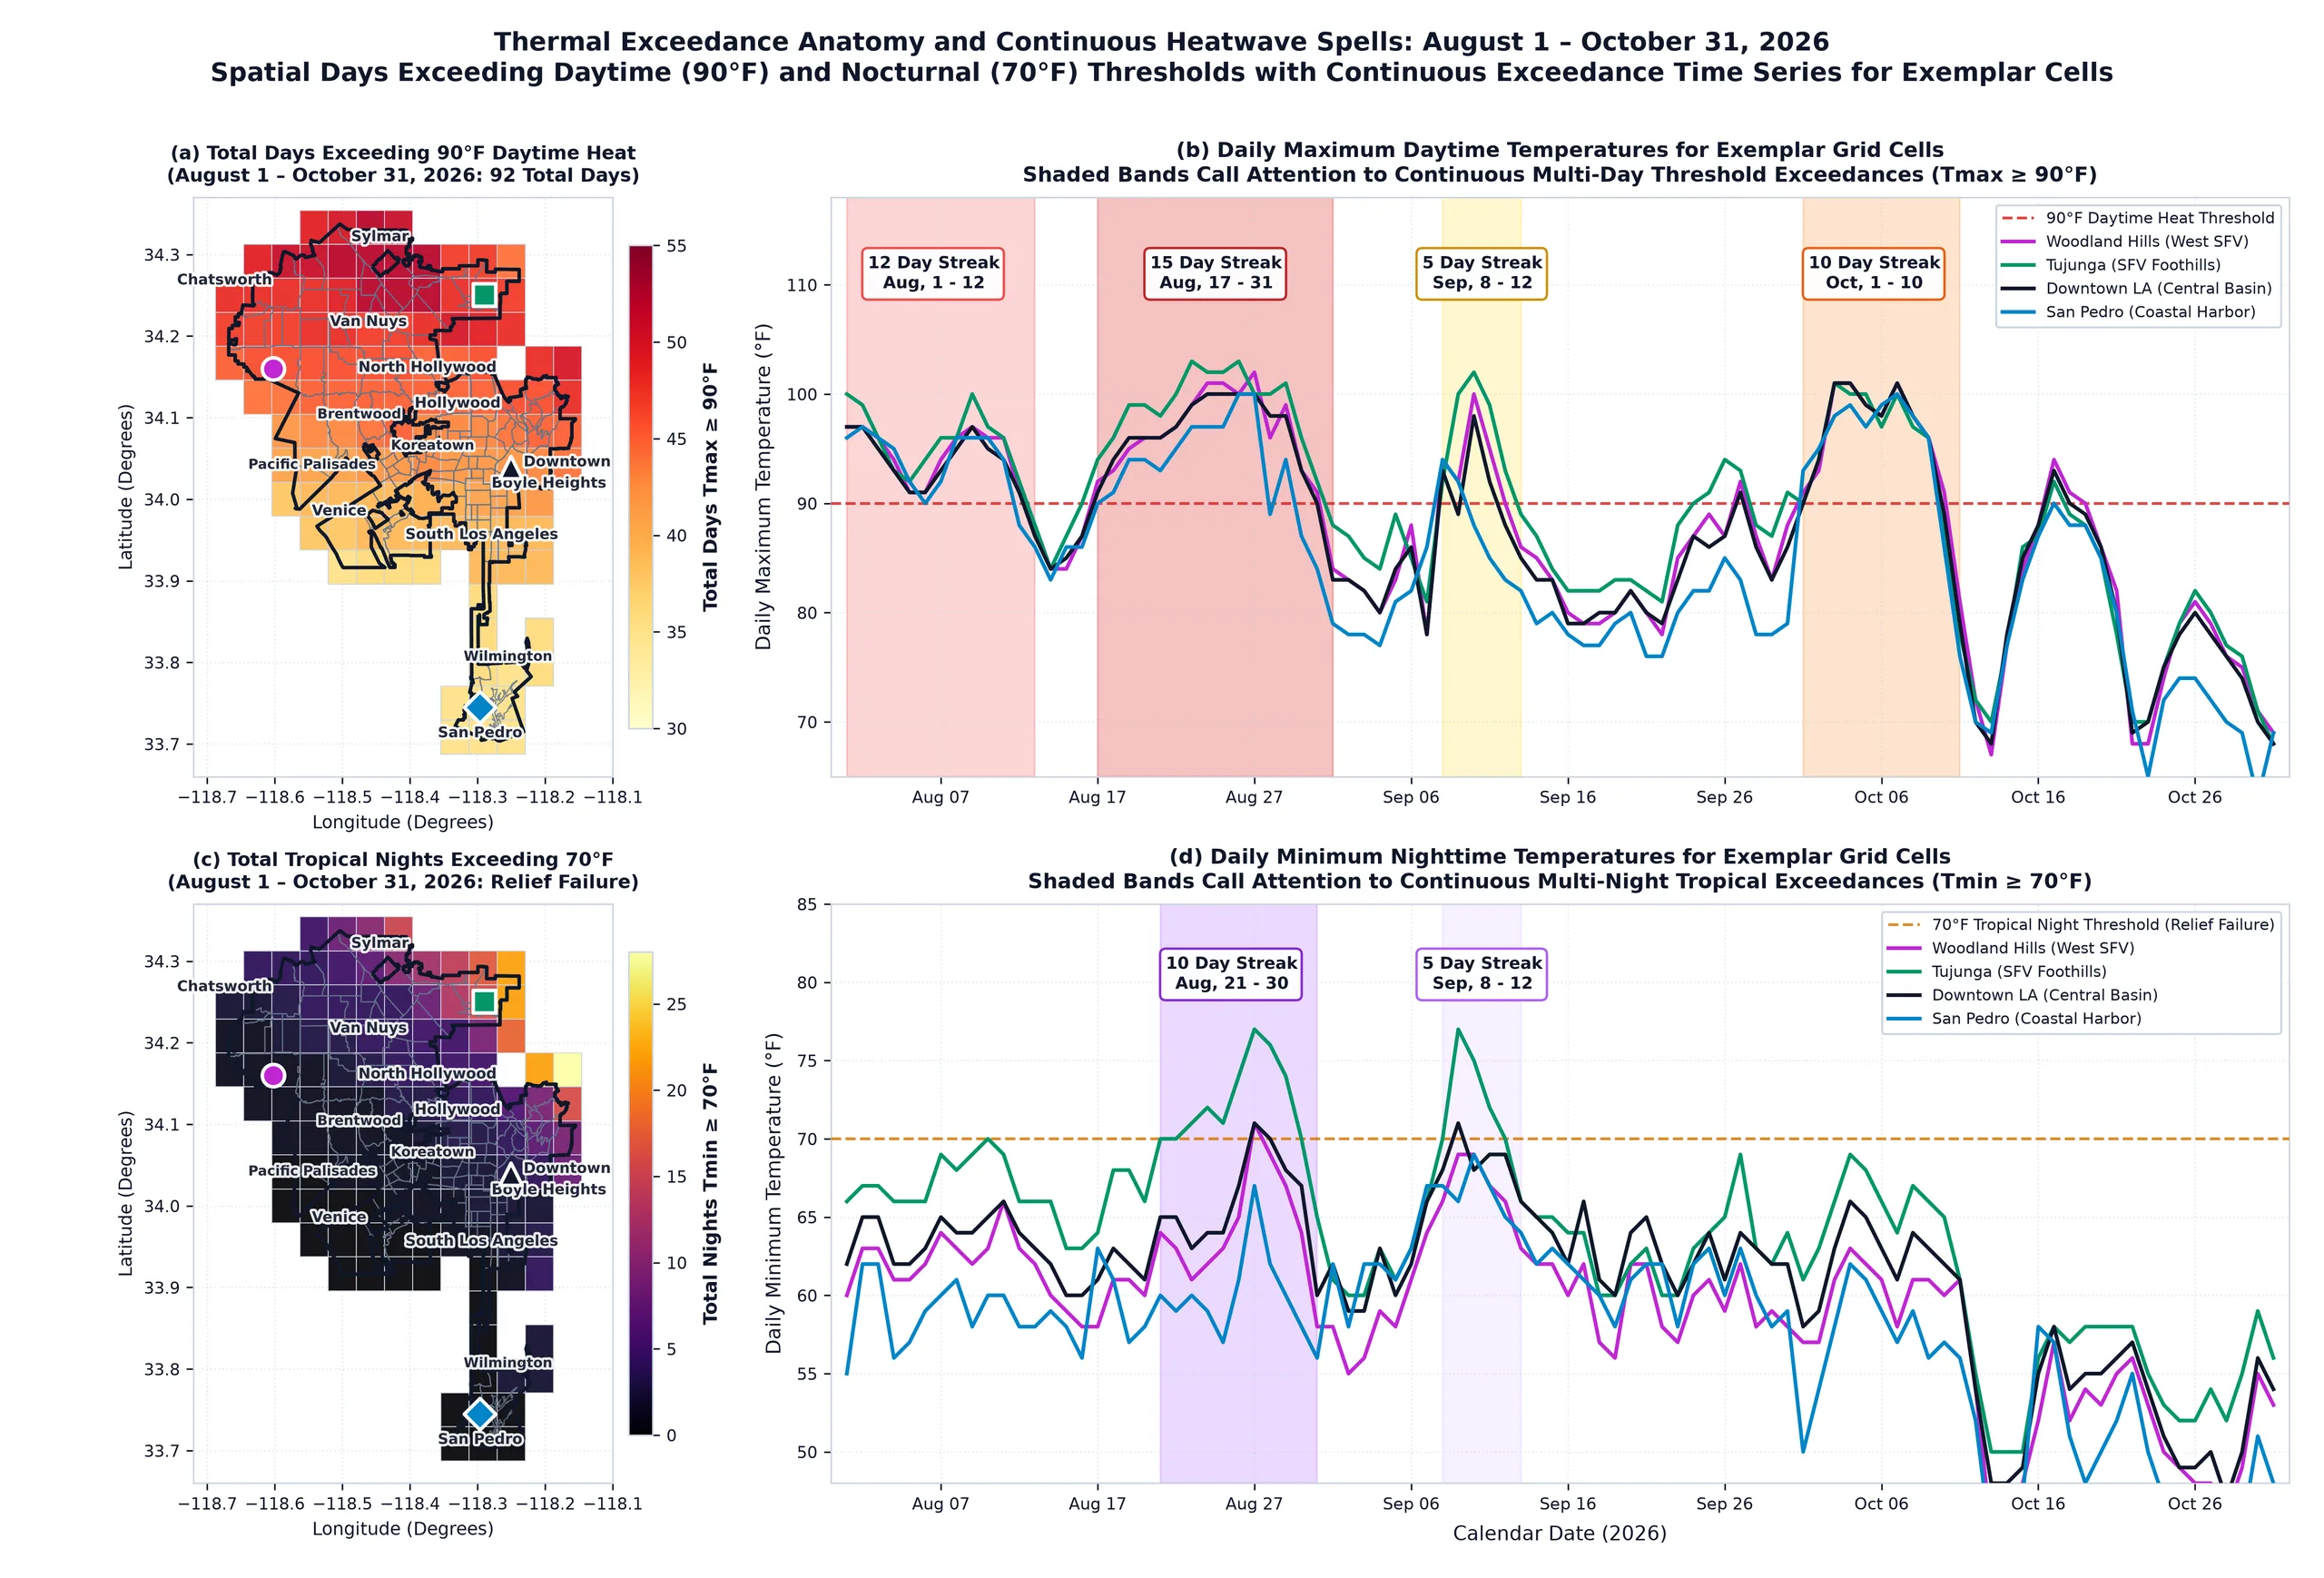
Thermal stress can compound non-linearly when extreme heat conditions persist without overnight relief. Across this 3-month period, daytime maximums exceeded 90°F for up to 52 days in inland valleys. Simultaneously, overnight lows remained above 70°F on up to 28 nights within foothill and dense urban corridors. Citywide, the frequency of these “tropical” nights increased more than fourfold, rising from an average of 0.94 in 2025 to 4.03 in 2026. As depicted in Figure 6, neighborhood level time-series analysis demonstrates these trends, documenting a 15-day daytime threshold exceedance (August 17–31) in Woodland Hills and interior basin communities enduring a 10-night nocturnal heatwave (August 21–30) during which the cooling benefits of natural ventilation mechanisms would have completely failed. By contrast, coastal locations such as San Pedro recorded zero tropical nights, demonstrating the protective influence of the marine boundary layer.
Rate Analysis
Much of the public debate surrounding recent high summer utility bills has centered on LADWP’s recent retail rate increases. To evaluate the marginal contribution of these rate adjustments in determining recent customer bills, we benchmark tariff structures using data from the City of Los Angeles Office of Public Accountability (OPA) and LADWP’s public rate tariff documentation. We then compare the relative magnitude of LADWP’s year over year electrical rate changes to that of the recent 2026 summer heat for a representative set of residential home archetypes.
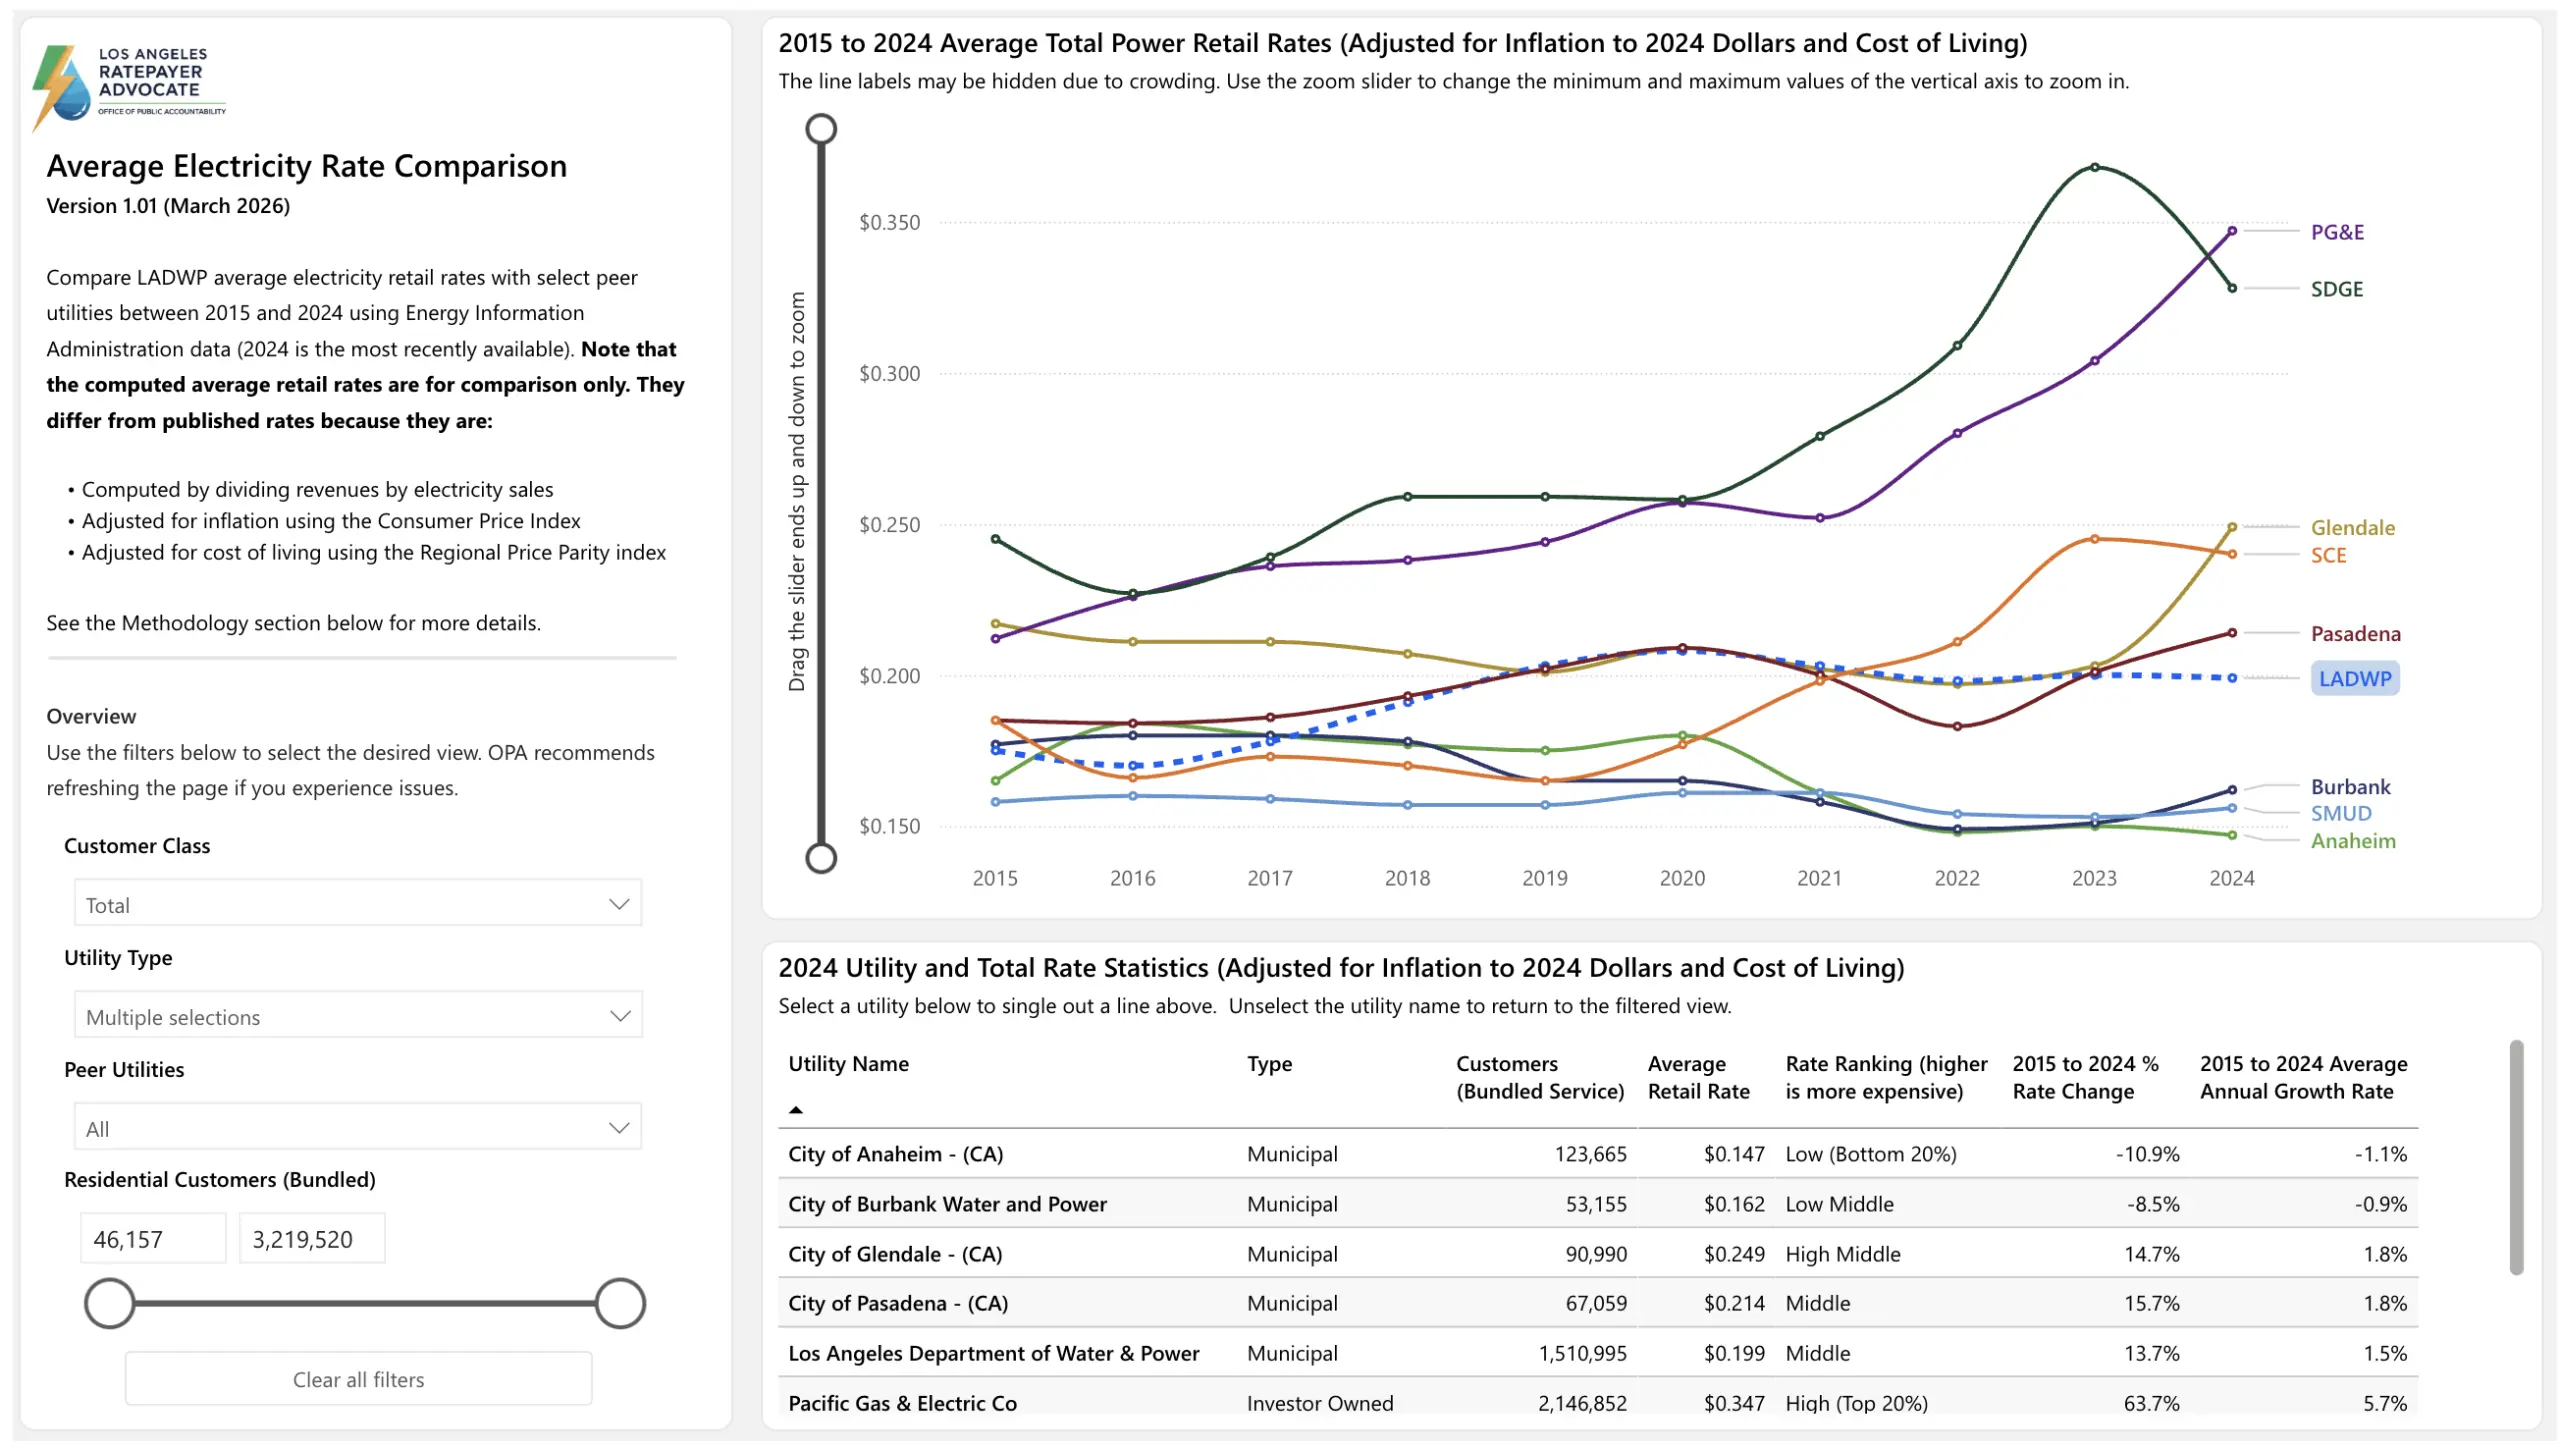
As illustrated by the LADWP Office of the Public Advocate’s (OPAs) Average Electricity Rate Comparison Dashboard (Figure 7), as of 2024, LADWP’S retail rates were among the lowest in California. Benchmarking bundled utility revenues against total sales demonstrates that municipal average rates (21–23¢/kWh) track 30% to 50% below neighboring investor-owned utilities. Southern California Edison averaged 28–36¢/kWh, while Pacific Gas and Electric and San Diego Gas and Electric exceeded 42¢/kWh in this same period. While public power insulates residents from investor-owned utility wildfire liabilities, system averages mask behind-the-meter billing dynamics under tiered tariff structures.
Within the LADWP service territory, most residential customers receive service under Schedule R-1A. This schedule enforces a seasonally differentiated, three-tiered inverted block structure. Consumption within baseline allowances is billed at Tier 1, while additional consumption incurs escalating marginal charges in Tiers 2 and 3. Between summer 2025 and summer 2026, total volumetric rates increased across all tiers as shown below in Table 1.
| Billing Season | Rate Tier | 2025 Rate (¢/kWh) |
2026 Rate (¢/kWh) |
YoY Absolute Change (¢/kWh) |
YoY Percentage Change (%) |
|---|---|---|---|---|---|
| Summer (July–September) |
Tier 1 (Baseline) | 24.31 | 26.41 | +2.10 | +8.6% |
| Tier 2 (Intermediate) | 30.17 | 32.27 | +2.10 | +7.0% | |
| Tier 3 (High-Use) | 38.87 | 40.97 | +2.10 | +5.4% | |
| Autumn (October) | Tier 1 (Baseline) | 24.60 | 27.29 | +2.69 | +10.9% |
| Tier 2 (Intermediate) | 30.46 | 33.15 | +2.69 | +8.8% | |
| Tier 3 (High-Use) | 30.46 | 33.15 | +2.69 | +8.8% |
To decompose the effect of volumetric tariff increases from climate-driven load growth we represent bill escalation rates using the following three-factor formulation:
Bill = ΔBillrate + ΔBillvolume + ΔBilltier_interaction
The base rate component (Billrate) reflects prior-year consumption evaluated at 2026 tariff increments (+2.10¢/kWh in Summer). Weather-driven volume (Billvolume) captures incremental cooling kilowatt-hours billed at 2025 rates. The non-linear interaction term (Billtier_interaction) quantifies the financial penalty incurred when cooling loads push consumption into upper rate tiers. Because LADWP operates on a bi-monthly billing schedule, all consumption totals, baseline allowances, and dollar charges represent pro-rated monthly equivalents.
To examine spatial and structural equity, we evaluate three housing archetypes spanning municipal climate zones:
- Coastal / Basin Multi-Family Apartment (Zone 1): Modest non-cooling base load with intermittent window cooling during peak days (380 kWh 460 kWh, +21.1%).
- Central Basin / South LA Single-Family Residence (Zone 1): Pre-1980 single-family structure with central air conditioning, poor attic insulation, and elevated nighttime thermal loads (650 kWh 765 kWh, +17.7%).
- San Fernando Valley Single-Family Residence (Zone 2): Inland suburban residence subjected to persistent triple-digit heat and tropical nights, forcing extended A/C compressor duty cycles into Tier 3 (1,100 kWh 1,550 kWh, +40.9%).
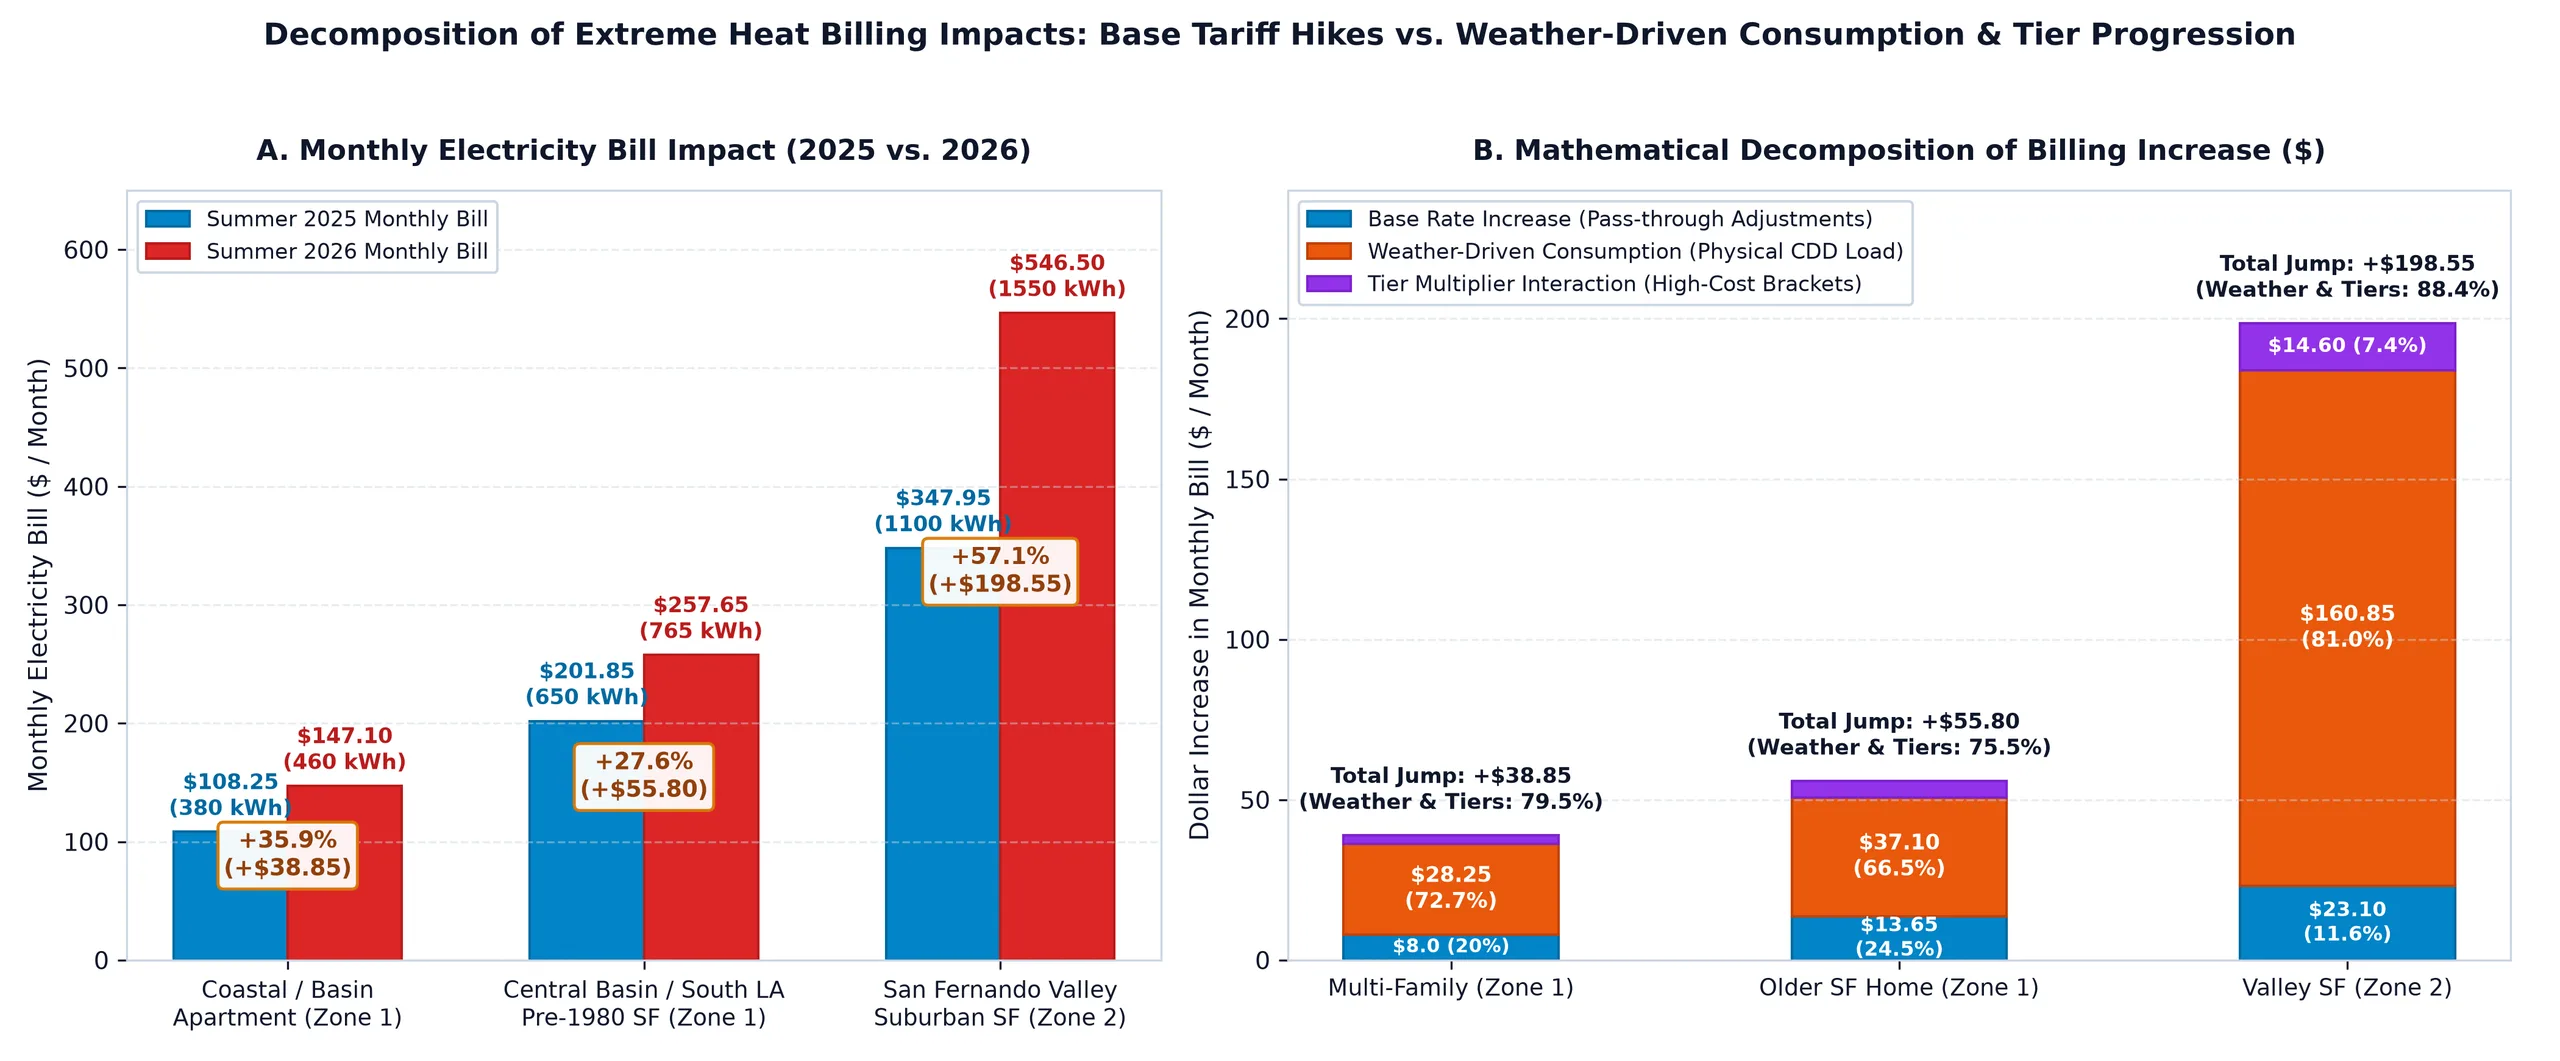
Figure 8 and Table 2 below show results for the estimated changes in absolute monthly bills (left) and outputs from the three-factor bill decomposition (right) for each of these three customer archetypes based upon modeled changes in customer usage and known rate tariff structure differences between 2025 and 2026. Detailed documentation for the modeling methods and assumptions used to develop these estimates is provided in the Appendix.
| Customer Archetype & Housing Profile |
Baseline Zone & Tier Status |
Summer 2025 Consumption & Bill |
Summer 2026 Consumption & Bill |
Total Bill Jump ($ / %) |
Base Rate Tariff Effect ($ / %) |
Weather Volume Effect ($ / %) |
Tier Progression & Interaction ($ / %) |
Total Weather & Tier Share (%) |
|---|---|---|---|---|---|---|---|---|
| Coastal / Basin Apartment (Multi-Family, Window A/C) |
Zone 1 (350 kWh Base) Tiers 1 & 2 |
380 kWh $108.25 |
460 kWh $147.10 |
+$38.85 (+35.9%) |
+$7.98 (20.5%) |
+$28.25 (72.7%) |
+$2.62 (6.8%) |
79.5% |
| Central Basin / South LA Home (Pre-1980 SF, Central A/C) |
Zone 1 (350 kWh Base) Tiers 1 & 2 |
650 kWh $201.85 |
765 kWh $257.65 |
+$55.80 (+27.7%) |
+$13.65 (24.5%) |
+$37.10 (66.5%) |
+$5.05 (9.0%) |
75.5% |
| San Fernando Valley Home (Suburban SF, Central A/C) |
Zone 2 (500 kWh Base) Tiers 1, 2 & 3 |
1,100 kWh $347.95 |
1,550 kWh $546.50 |
+$198.55 (+57.1%) |
+$23.10 (11.6%) |
+$160.85 (81.0%) |
+$14.60 (7.4%) |
88.4% |
Across all three archetypes, weather-driven cooling demand and progressive tier escalation constitute the vast majority of customer bill increases (75.5% to 88.4%). In the San Fernando Valley, where summer cooling degree days reached 936.2 CDD and temperatures exceeded 90°F in 48 days, additional cooling related electricity consumption likely pushed many households into Tier 3 (40.97 ¢/kWh). As a result of this, base rate tariff adjustments accounted for only 11.6% of the customer’s total modeled $198.55 bill jump, while physical climate demand and tier progression drove the remaining 88.4%.
Conclusions
LADWP’s inverted block tariff acts as a financial multiplier during prolonged heat events. Baseline Tier 1 allowances (350 kWh/month in Zone 1; 500 kWh/month in Zone 2) cover only essential non-cooling loads. Consequently, incremental air conditioning compressor loads fall directly into Tier 2 (32.27¢/kWh) and Tier 3 (40.97¢/kWh). Households enduring multi-day heatwaves can therefore face marginal electricity prices up to 55.1% above baseline tiers.
The poor thermal performance of the City’s aging residential building stock can amplify these financial impacts, particularly within low-income and disadvantaged communities. Legacy pre-1978 construction vintage buildings frequently lack adequate wall and ceiling insulation or high-performance double-pane windows, accelerating daytime solar heat gains. Additionally, stubbornly high nighttime temperatures can cause air conditioning units to be run continuously and at temperature ranges where their efficiencies are significantly reduced. This suggests the need for a more thoughtful and comprehensive approach to managing the customer bill impacts from prolonged extreme heat within the city going forwards.
Appendix: Detailed Modeling Methods and Assumptions
1. Thermodynamic Formulation of Weather-Driven Cooling Loads
Monthly residential electricity consumption is modeled as the linear superposition of temperature-insensitive baseline household load (Ebase) and climate-driven space cooling demand (Ecool):
Emonthly = Ebase + Ecool
To isolate climatic forcing from volumetric tariff tier progression, non-cooling base load (Ebase) is held constant year-over-year (YoY) within each archetype (350 kWh/mo for Coastal Multi-Family; 450 kWh/mo for Older Central Single-Family; 550 kWh/mo for Valley Suburban Single-Family).
Weather-sensitive space cooling electricity demand (Ecool, in kWh) is derived from a physical steady-state heat balance parameterized against 4 km gridded meteorological observations from the Oregon State University PRISM Climate Group:
Ecool = 24 · UA · CDD65 3412.14 · COPeff
Where:
- 24 converts daily degree days to equivalent hourly degree hours (hours/day).
- UA represents the building envelope overall thermal conductance (Btu/hr⋅°F), integrating wall, fenestration, ceiling/roof, and infiltration heat transfer.
- CDD65 represents monthly cumulative Cooling Degree Days evaluated relative to a 65°F thermal equilibrium balance point ∑max(0,Tmean – 65°F)).
- 3412.14 is the physical conversion constant between British Thermal Units and kilowatt-hours (Btu/kWh).
- COPeff is the effective operational Coefficient of Performance of the cooling equipment.
2. Temperature-Dependent Efficiency Derating Model
The effective coefficient of performance (COPeff) captures real-world thermodynamic efficiency losses under elevated ambient condensing temperatures and nocturnal heat retention:
COPeff = COPrated · [1 − β · max(0, Tcondenser − Trated)] · ηnocturnal
Where:
- COPrated is the nameplate efficiency under AHRI Standard 210/240 rating conditions (Trated = 95°F outdoor dry-bulb temperature; COP = EER / 3.412).
- β ≈ 0.0125 / °F is the sensible refrigeration cycle capacity degradation rate (representing a 1.25% efficiency reduction per degree above 95°F).
- ŋnocturnal∈[0.85,1.00] is the nocturnal convective relief factor. When overnight ambient temperatures remain above 70°F (tropical nights), condenser heat rejection is impeded, building structural cores fail to discharge daytime heat gain, and the compressor is forced into continuous 24-hour operation.
3. Structural and HVAC Assumptions Across Housing Archetypes
| Engineering Parameter / Metric | Archetype 1: Coastal / Basin Multi-Family (Zone 1) | Archetype 2: Central Basin / South LA Pre-1980 SF (Zone 1) | Archetype 3: San Fernando Valley Suburban SF (Zone 2) |
|---|---|---|---|
| Conditioned Floor Area | 750 sq ft | 1,350 sq ft | 2,100 sq ft |
| Envelope Conductance (UA) | 210 Btu/hr⋅°F | 510 Btu/hr⋅°F | 720 Btu/hr⋅°F |
| Envelope Thermal Characteristics | Shared party walls; reduced exterior exposure; low infiltration. |
Uninsulated 2×4 framing; single-pane windows; dark unvented attic. |
1970s Title 24 baseline; high roof solar gain; west-facing glazing. |
| Cooling System Typology | Single-room window A/C (0.8–1.0 ton) |
Legacy central split-system DX (2.5 ton) |
Central split-system heat pump / A/C (4.0 ton) |
| Rated Efficiency (COPrated) |
EER 9.8 (COP=2.87) |
SEER 11 / EER 9.0 (COP=2.64) |
SEER 14 / EER 11.5 (COP=3.37) |
| Observed Ambient Climate (Aug–Oct 2026) |
793.1 CDD; Peak 102°F; 0.6 tropical nights |
836.7 CDD; Peak 101°F; 1.8 tropical nights |
954.0 CDD; Peak 106°F; 7.0 tropical nights |
| Thermal Derating Penalty | -5.0% (daytime peak derating) |
-12.0% (attic heat retention + night cycles) |
-28.0% (continuous triple-digit heat + no night reset) |
| Effective Efficiency (COPeff) |
2.73 | 2.32 | 2.43 |
| Summer 2025 Consumption | 380 kWh / month | 650 kWh / month | 1,100 kWh / month |
| Summer 2026 Consumption | 460 kWh / month | 765 kWh / month | 1,550 kWh / month |
| Marginal Consumption Jump (ΔE) |
+80 kWh / month (+21.1%) |
+115 kWh / month (+17.7%) |
+450 kWh / month (+40.9%) |
4. Narrative Description of Housing Archetypes
Archetype 1: Coastal / Basin Multi-Family Apartment (Zone 1)
Occupies an intermediate-floor multi-family unit insulated by adjacent apartments. Cooling is delivered via an intermittent window or ductless unit (COPrated = 2.87). Because coastal marine layer penetration maintained nighttime minimums below 65°F (averaging 0.6 tropical nights citywide), ambient condensing temperatures remained close to standard rating baselines. Applying a modest 5% peak-period derating yields COPeff = 2.73. Monthly consumption rose from 380 kWh to 460 kWh (+80 kWh/mo, +21.1%), reflecting targeted daytime window unit operation during acute heatwave spikes.
Archetype 2: Central Basin / South LA Pre-1980 Single-Family Home (Zone 1)
Reflects an older single-family structure with high envelope heat gain (UA ≈ 510 Btu/hr⋅°F) conditioned by a legacy SEER 11 split system (COPrated = 2.64). Inadequate attic insulation and dark roofing caused severe daytime thermal absorption. Concurrently, nocturnal minimums above 70°F trapped heat within the structure, forcing the compressor to cycle through late evening hours. This combination induced a 12% operational performance penalty (COPeff = 2.32). Monthly consumption climbed from 650 kWh to 765 kWh (+115 kWh/mo, +17.7%), concentrated within Tier 2 marginal pricing brackets.
Archetype 3: San Fernando Valley Suburban Single-Family Home (Zone 2)
A suburban residence with substantial solar exposure (UA ≈ 720 Btu/hr⋅°F) served by a 4-ton split system (COPrated = 3.37). The San Fernando Valley endured the most acute regional heat burden: 48 days ≥ 90°F, 11 days ≥ 100°F (peaking at 106°F), and 7 to 10 consecutive tropical nights (Tmin ≥ 70°F). Extreme ambient condensing conditions and the total loss of nighttime pre-cooling windows forced the compressor into continuous duty cycles under high head pressure, degrading efficiency by 28% (COPeff = 2.43). As a consequence, monthly consumption surged from 1,100 kWh to 1,550 kWh (+450 kWh/mo, +40.9%), pushing household usage directly into LADWP Schedule R-1A Tier 3 (40.97¢/kWh).
Units
Topics
Meet the Author