Environmental Bonds Should Equitably Benefit All Communities
Link no longer works, but kept here for historical purposes. https://websites.greeninfo.org/ucla/prop84/ Use this interactive map to explore Prop 84 grants throughout the state. You can generate custom PDFs of any…
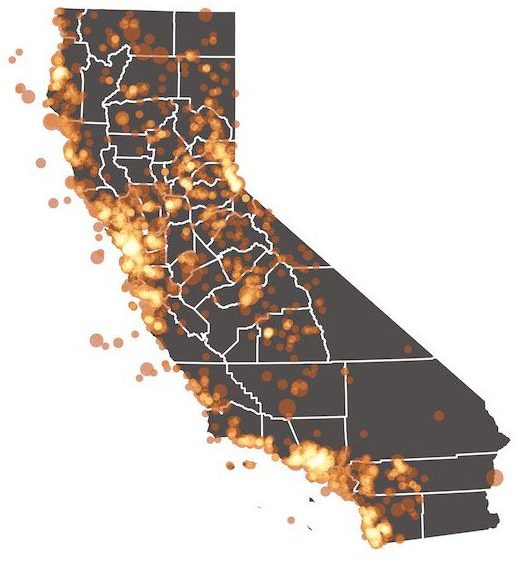
Link no longer works, but kept here for historical purposes. https://websites.greeninfo.org/ucla/prop84/
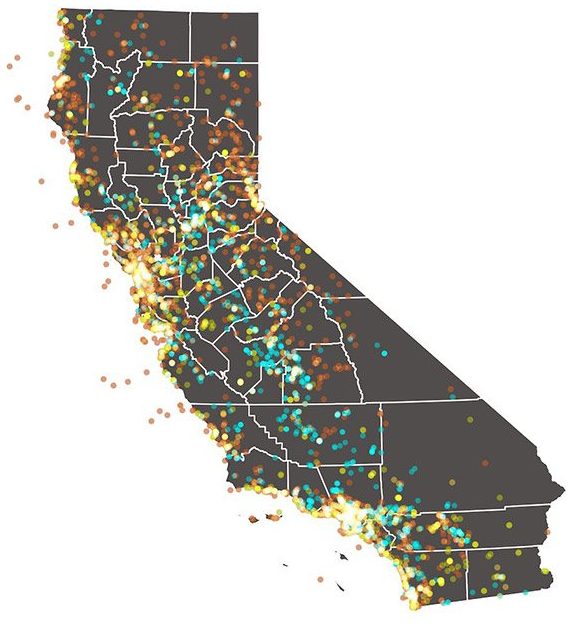
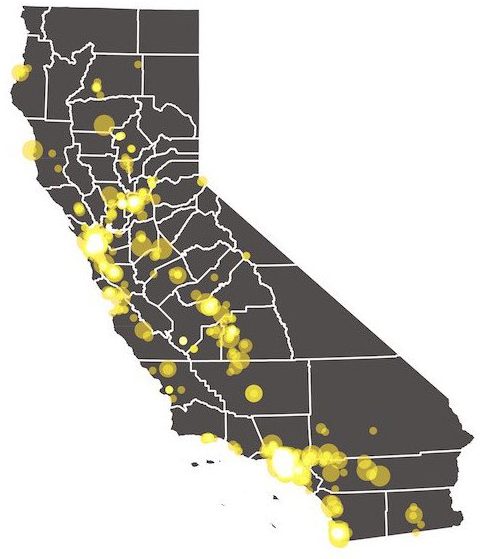
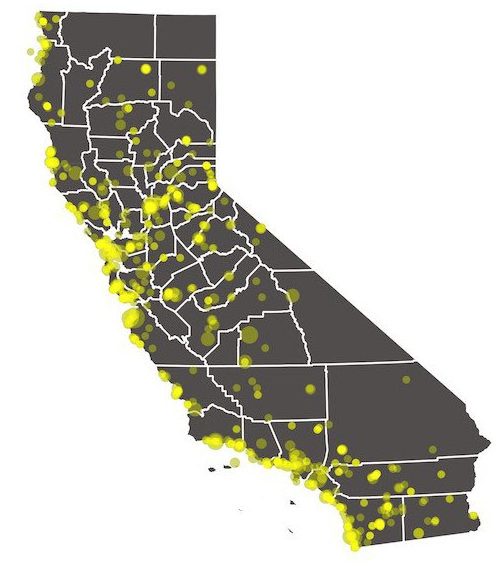
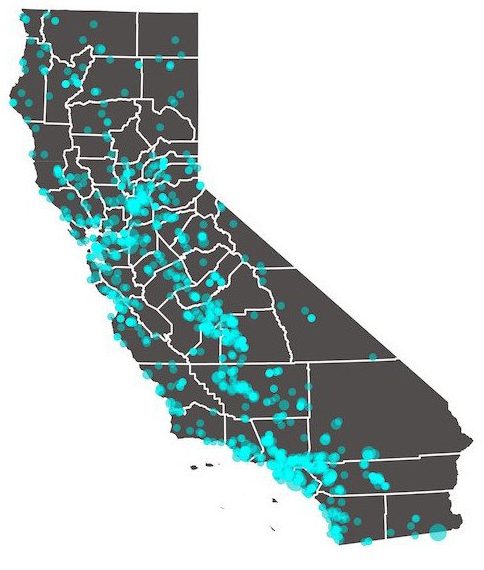
Use this interactive map to explore Prop 84 grants throughout the state. You can generate custom PDFs of any area you select, or download a table or shapefile of the complete database.
Looking Forward Based on an Analysis of Prop 84
Jon Christensen, UCLA, Institute of the Environment and Sustainability
In 2006, California voters approved Proposition 84, a bond measure authorizing $5.4 billion in spending on projects to improve parks, natural resource protection, and water quality, safety, and supply. Most of that money has now been spent.
Where was the funding spent? Who benefited? And were funds spent according to the priorities stated in the measure approved by voters?
Prop 84 is a good case study for examining these questions: the measure sought to ensure equitable distribution of bond funds by prioritizing investments in various sections. Some sections of the measure explicitly prioritized funding for disadvantaged communities, for example, including sections on parks and safe drinking water, while other sections more vaguely prioritized bond expenditures. And some sections did not prioritize investments in any specific manner, instead allocating funds to agencies in general categories. The results are telling.
Overall, although “local parks and urban greening” were listed as a priority for the bond as a whole, we found that communities that lack parks received less funding than areas that already have parks. And we found that rural areas, with lower population density, received just as much funding as urban areas with larger populations. And we found that less Prop 84 funding has been spent in disadvantaged communities than in communities with higher median household income.
Most importantly, we found that when priorities were clearly spelled out, funds were spent according to those priorities. By contrast, when priorities were only vaguely stated, we found that spending was not closely aligned with those priorities.
We conclude that more attention should be paid to establishing priorities, setting criteria, and using available data to shape strategies in order to achieve more equitable distribution of bond monies across communities. If legislators and voters have specific priorities, such as allocating bond funding more equitably, we need to be explicit about those priorities and set criteria for choosing projects that fit the bill. Otherwise we risk ending up with results that are no better than random or even run counter to those priorities. If serving the people of California, particularly in disadvantaged communities, is an important priority for environmental bonds, then people need to be put explicitly into the equation.
We also need better data to measure the results of bond spending and improve our future performance. It was not easy to assemble the data required to answer even such simple questions as those posed above. Our recommendations at the end of this report include basic improvements in data collection, reporting, and availability so that citizens and policy makers can track and improve how public funds are spent, with the help of research such as ours.
How This Study Was Conducted
This analysis examines spending in relation to specific priorities that were explicitly stated in Prop 84 and were meant to prioritize funding for particular communities, including disadvantaged communities, park poor neighborhoods, and urban areas. We focused on the $2 billion granted to projects with an identifiable local impact out of the $3.9 billion granted to projects so far. We did not examine large regional projects and planning projects where we could not identify a local community benefit. This is not an audit of individual projects. For the purpose of this analysis, our assumption is that all of the funds were allocated to achieve the stated purposes of the bond. We do not analyze the purely environmental or conservation benefits of projects. Instead, this report provides a systematic diagnostic analysis of the effectiveness of establishing priorities for more equitable allocation of bond funding to communities in need using data provided by the state of California’s bond accountability web site, state agencies, CalEnviroScreen, and the U.S. Census Bureau.
Mixed Priorities Lead to Mixed Results
Prop 84 specifically prioritized investments in “disadvantaged communities” in several sections of the proposition, as well as in enabling legislation under AB 31. Park-poor communities were also designated as priorities in several sections of the proposition, as were urban communities. Overall, these mixed priorities led to mixed results.
We found that disadvantaged communities—with median household income below a 40 percent threshold—received 45 percent of Prop 84’s funding for projects with an identifiable local impact, while 55 percent went to communities with higher median household incomes. This may sound like marginally good news for a bond measure that explicitly prioritized disadvantaged communities in a variety of ways. However, other findings lead us to be cautious about concluding too much from this one indicator. We found that Prop 84 funding for projects with a local impact was evenly divided between rural areas, with fewer people, and more densely populated urban communities. Residents in rural areas within a half-mile walking distance of projects saw $7,475 per capita in spending in their neighborhoods, while residents in urban areas saw $209 in per capita spending. And we found that 56 percent of the funding overall was spent in areas that already had more park acres for each resident, while 44 percent was spent in park-poor areas.
Drilling down into the individual chapters of Prop 84 tells us more about how the measure’s priorities shaped how funds were distributed and who benefited.
Explicit Priorities Work: The AB 31 Model
One section of Prop 84—chapter 9, which covered funding for “sustainable communities and climate change reduction,” including “urban greening projects”—set aside $400 million for competitive grants administered by the Department of Parks and Recreation. It stated that “underserved communities” and “creation of parks in neighborhoods where none currently exist shall be given preference.” It called for enabling legislation to further define the criteria and process for selecting projects. AB 31 spelled out specific criteria for a “critically underserved community” as one with “less than 3 acres of usable park land per 1,000 residents,” a “disadvantaged community” as one with median household income less than 80 percent of the statewide average, and a “severely disadvantaged community” as one with less than 60 percent of the statewide average.
Of the $358 million spent so far under AB 31, we found that $346 million has been spent in urban communities, $312 million has been spent in underserved, park-poor communities, and $276 million of the total has been spent in disadvantaged communities, with $152 million of that spent in severely disadvantaged communities. Communities that met all three criteria—urban, park-poor, and disadvantaged—received $244 million of the total.
The process for choosing qualified projects under AB 31 was managed by the Department of Parks and Recreation. Explicit criteria guided the department in funding projects that are helping to expand access to parks in communities most in need in California, a key goal of the department. By contrast, when Prop 84 allocated $500 million for state parks, it set a much looser priority that $400 million of that funding should go to improving existing facilities, protecting natural resources, and “expansion of the state park system to reflect the growing population and shifting population centers and needs of the state.” Of the $303 million spent so far, $236 million has been spent on grants with an identifiable local impact. While urban communities received 60 percent of that funding, park poor communities received only 19 percent, and communities that are both park poor and urban received only 13 percent. Overall, communities that had more park acres per 1,000 people received more funding than communities with fewer park acres.
Absent AB 31’s explicit criteria, the state parks section of Prop 84 did not do as well in prioritizing expansion of parks in areas of the state most in need of parks. If there is a lesson here, it is that explicit criteria can lead to better targeted results than vaguely stated priorities. AB 31 should be a model for prioritizing and implementing spending in future bonds, whether the priority is parks in disadvantaged communities, water safety, or any other priority. AB 31 carefully defined measurable criteria for selecting projects to meet its goals. Other sections of Prop 84 did not do that. But they could have. And future bonds should.
Mixed Priorities, Not So Much: Water Quality and Safety
We found a different pattern when two priorities were listed together in the section of Prop 84 that provided $1.5 billion for safe drinking water and water quality projects. This spending was moderately successful in targeting funding for disadvantaged communities, which was one of the priorities listed as a priority for $1.2 billion of that spending. We found that 51 percent of the $143 million spent so far with an identifiable local impact on water quality and safety went to disadvantaged communities that are home to 40 percent of the state.
However, we found unclear results in this section of Prop 84 when it came to its primary mission: water quality and safety. The distribution of funds in relation to groundwater contamination and drinking water quality problems could as well have been random. Communities identified as having more groundwater contamination and drinking water quality problems by CalEnviroScreen received no more funding than communities with fewer groundwater contamination and drinking water quality problems.
Our analysis of this section of Prop 84 raises particularly interesting and troubling questions about priorities and targeting of bond spending, and suggests potentially promising paths forward. This section of Prop 84 has more successfully targeted disadvantaged communities, by indicating that they are a priority. On the other hand, our findings suggest that more specific criteria for targeting water quality and safety improvements could have been warranted. Our findings also suggest that CalEnviroScreen scores could be used, if appropriate, in a project screening and prioritization process similar to AB 31 to target spending better.
Not a Priority: Disadvantaged Communities and Resource Protection
When it came to spending the $1.9 billion earmarked in Prop 84 for traditional resource protection and conservation of land, rivers, beaches, and bays—which did not explicitly prioritize disadvantaged communities—the results were not surprising. Of the $984 million spent so far on grants with an identifiable local impact, we found that $758 million, 77 percent, went to rural areas, while urban areas received $226 million or 23 percent. Rural residents within walking distance of projects saw $9,860 in per capita spending, while residents near urban projects saw $161 in per capita spending in their neighborhoods. Park poor areas received 30 percent of this funding, while 70 percent went to areas with adequate parks. And only 36 percent of this funding went to disadvantaged communities. Moreover, communities with higher median household income received as much funding as communities with lower income. So the benefits we see in disadvantaged communities could as well be random.
We Could Do Much Better with Explicit Priorities
California is muddling through. Even when we don’t focus explicitly on distributing bond funding for environmental benefits to communities most in need, such as in the resource protection section of Prop 84, we find that disadvantaged communities, home to 40 percent of the state’s population, receive close to that proportion of funding. However, if providing benefits to particular communities is truly a priority, rather than randomly distributing funds, we could do much better at prioritizing communities in need of environmental benefits. AB 31 established a path, and we have the data and tools at hand to better inform the entire process to achieve priorities approved by voters.
Recommendations:
The results of bond measures could be greatly improved by stating clear priorities, setting criteria for evaluating spending, using data for planning and selecting projects, and measuring success. The data needs to get a lot better and easier to use. To achieve these goals, we recommend:
- If you want results to benefit more people, put people into the equation, through population in service areas or other metrics of people served. A simple equation would be C/P, where C stands for Cost, divided by the number of People (P) served by a project. Alternatively, the equation C/EP could be used, where C stand for cost divided by the Environmental benefit of a project (E) multiplied by the number of People (P) served so that projects with similar environmental benefits could be compared.
- Define priorities for bond spending more clearly and set specific criteria to operationalize those values and specific goals to measure success. If necessary, use implementing legislation to establish more specific criteria and a process for prioritizing and selecting projects. Use AB 31 as a guide for this process.
- If better guidance is needed for spending by agencies, including regional conservancies, consider requiring that those agencies have strategic master plans in place with defined priorities and specific criteria for selecting projects. Require that actual bond spending is justified, accounted for, and reported in relation to those priorities and criteria.
- Improve and standardize data reporting requirements so that data is more readily available, easily accessible, reliable, and usable for accountability and research such as this report. This report required repeated special requests for data, as well as clarifications, wrangling, and cleaning of the data. This kind of effort should be made routine so that we can evaluate and learn more quickly, and further improve, at a fraction of the effort and cost that went into this report.
This report was written by Jon Christensen, adjunct assistant professor at the Institute of the Environment and Sustainability at UCLA. The analysis was conducted by Christensen, Ian Davies, and Peter Kareiva at the IoES, with data wrangling and cartography by GreenInfo Network, and design consulting by Stamen Design. This analysis was conducted under a grant from the Resources Legacy Fund. For more information, contact Jon Christensen at jonchristensen@ioes.ucla.edu.
