Assessing biodiversity indicators in Santa Monica
The City of Santa Monica has been ahead of the curve in terms of sustainability efforts. The city was the among the first to develop a sustainability report and provide…
The City of Santa Monica has been ahead of the curve in terms of sustainability efforts. The city was the among the first to develop a sustainability report and provide legal standing to nature through the Sustainability Rights Ordinance, which recognizes that “natural communities and ecosystems possess fundamental and inalienable rights to exist and flourish” (Ordinance 12.02). But to track progress in sustainability, you must measure it. Our practicum team will advance the city’s sustainability goals by evaluating indicators for the city’s biodiversity and urban forests. We will assess tree canopy coverage to track how tree cover has changed through time and which neighborhoods could benefit from tree planting programs; we will evaluate permeable surfaces to improve stormwater reduction; and we will consider which indicators the City can use to track changes in biodiversity. Through our work, the City of Santa Monica Office of Sustainability and the Environment can better make decisions regarding its urban ecosystem, improving sustainability programs, conservation initiatives, and keeping the city accountable by tracking their progress.
After performing analyses using ArcGIS, QGIS, iTree, and other methods, we were able to paint a clearer picture of the state of Santa Monica’s ecosystem. Some key figures include:
- 14% of Santa Monica’s total area is covered by tree canopy
- 47% of Santa Monica’s total area is made up of permeable surfaces
- Santa Monica’s trees save about $100,000 annually from air pollution costs
- Santa Monica’s trees save about $4,600,000 annually from carbon pollution costs
Below you will find images from our project, or click here to view our Final Report.
Figure 1: Tree Canopy Coverage 2020
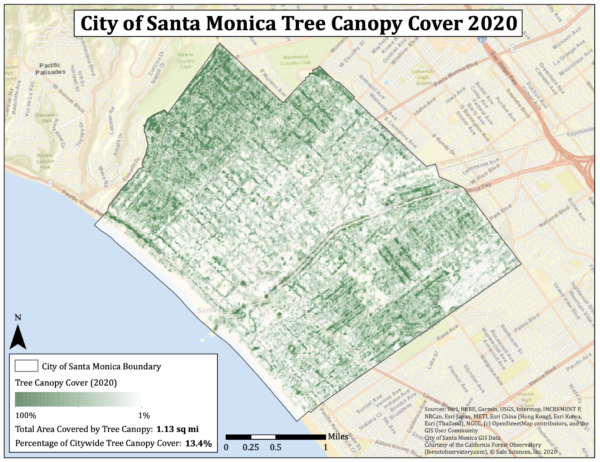
Figure 2: Tree Canopy Coverage by Neighborhood
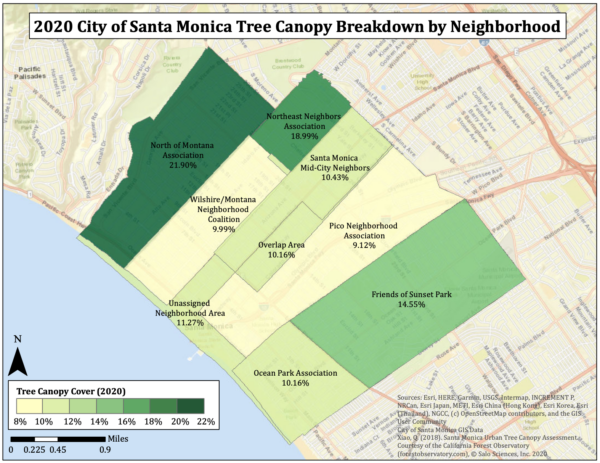
Figure 3: Land Permeability 2017
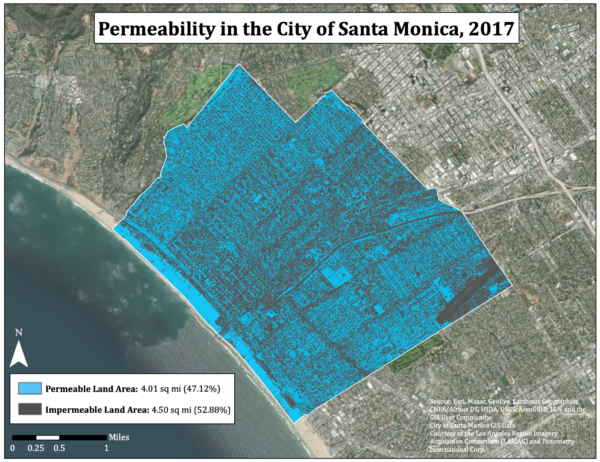
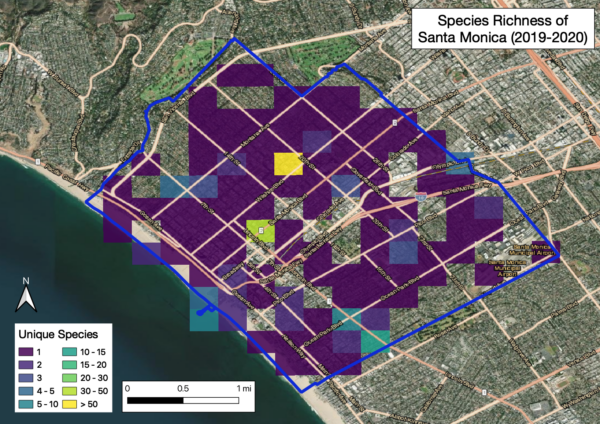
Figure 4: Species Richness 2020
Client: City of Santa Monica, Office of Sustainability
Student Team: Nina Adarkar, Stuart Muerth, Zachary Moore, John Phillips, Ayesha Sheikh, Ofelia, Vega-Morelos, and Kate Zeile
Advisor: Moana McClellan