Drones have quickly become an essential tool for environmental science and conservation. IoES affiliated professor Dr. Kyle Cavanaugh (Geography) has been using Sage Hill as a field site for research…
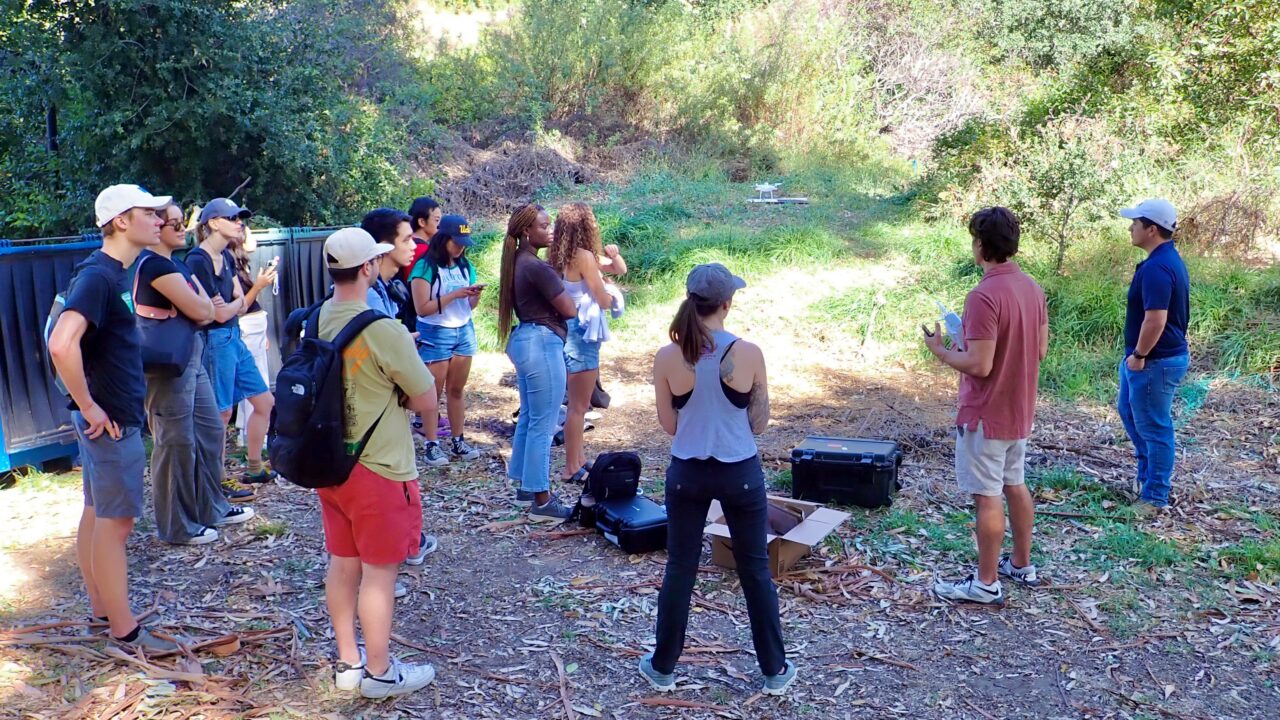
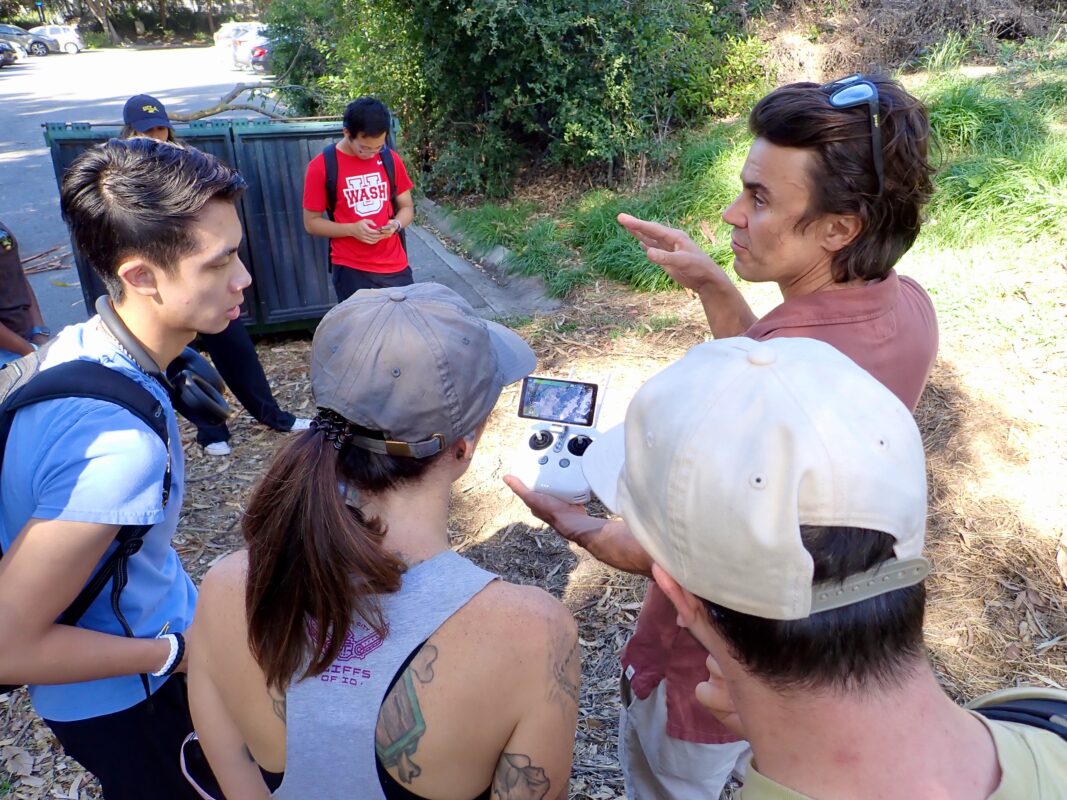
Dr. Kyle Cavanaugh and students from his Geography 185 course reviewing the drone flight plan for Sage Hill.
Drones have quickly become an essential tool for environmental science and conservation. IoES affiliated professor Dr. Kyle Cavanaugh (Geography) has been using Sage Hill as a field site for research and teaching with drones. Sage Hill has benefitted from this collaboration as we now have high-resolution time-series of drone images that can be used to document changes in Sage Hill’s environment and vegetation. As restoration progresses at Sage Hill, drone imagery can help us track our progress.
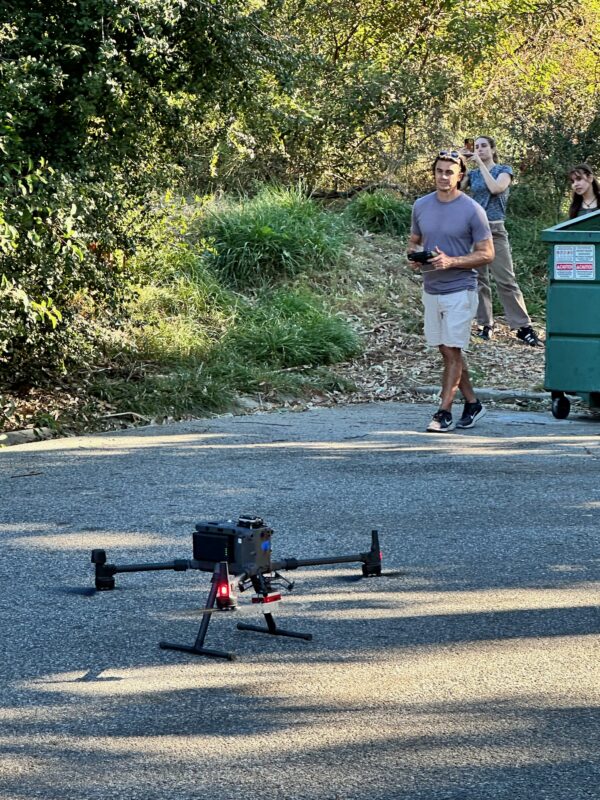
Retrieving a drone after a flight. Before a flight, students use precision GPS equipment to record the position of dozens of ground control points. These points are visible in the drone images and used to locate each pixel in the image to a point in 3-dimensional space.
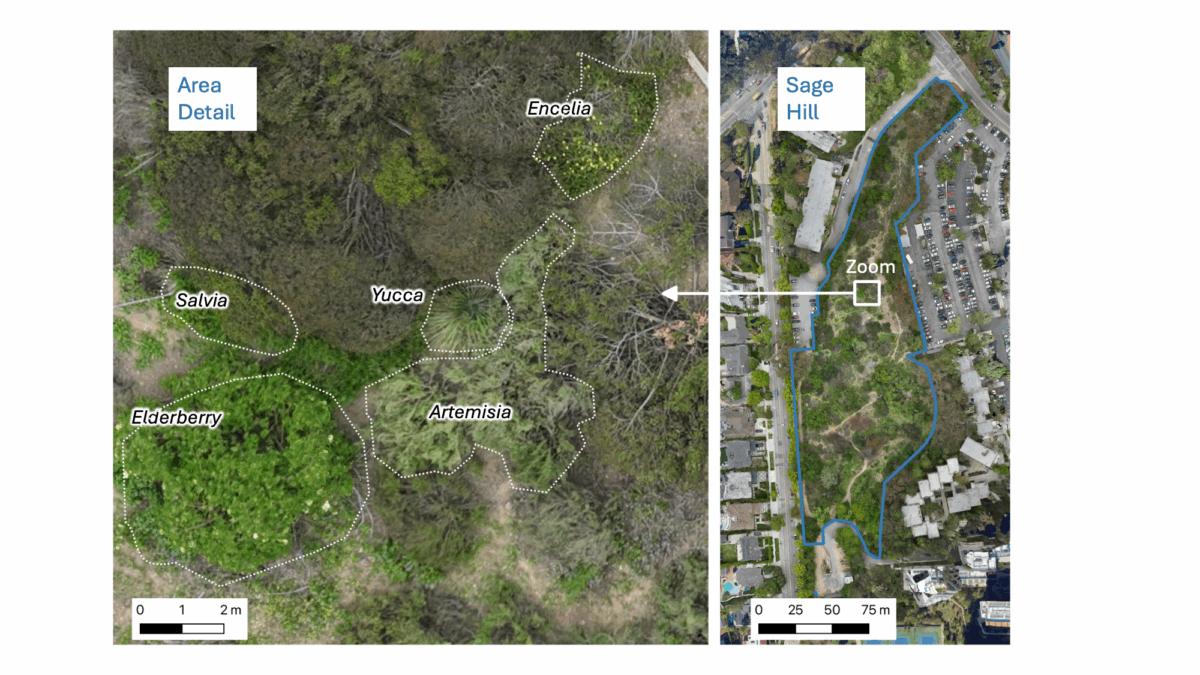
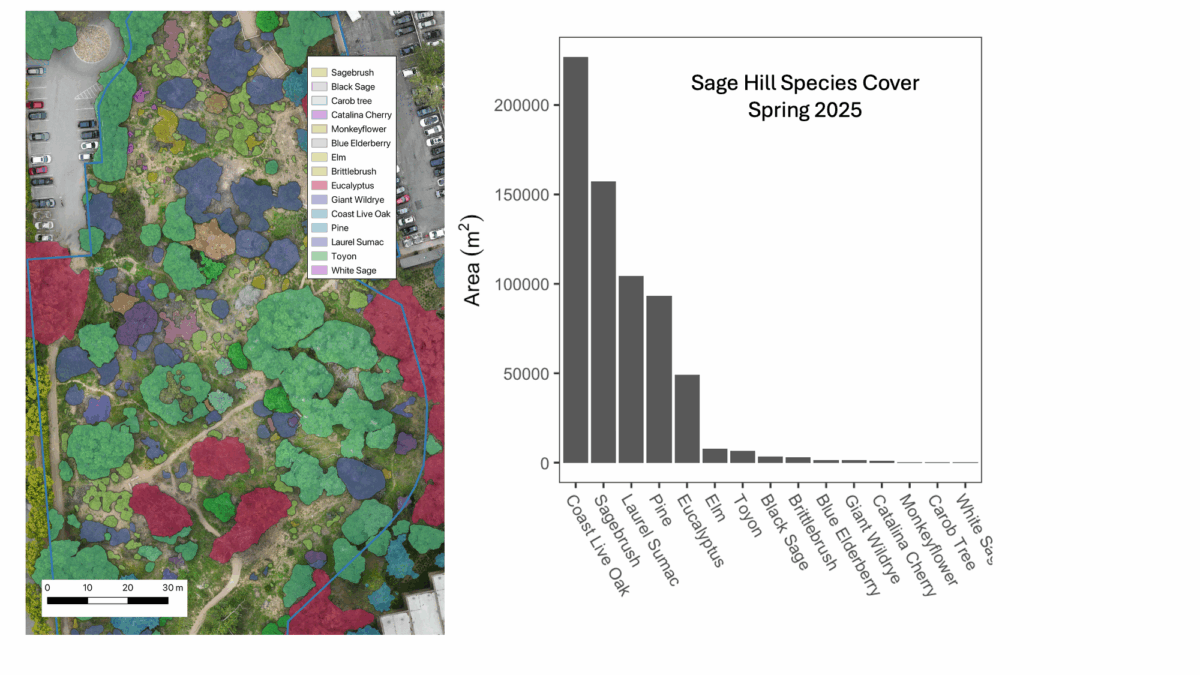
Plants observed in drone images at a cm scale resolution can be digitized to precisely record their position and size. By digitizing all the plant canopies in a drone image we can calculate the area covered by each species–a way of measuring plant cover at much greater levels of detail than manual field-based measurements such as point or line-intercept monitoring.
Sample area of native vegetation at Sage Hill showing drone image at high resolution (left) and at an overview of the whole site from April of 2025. High resolution images are suitable for digitizing identifying and mapping the size and position of individual species. The image on the left has canopies of five native species labeled as an example.
After digitizing the canopies from the entire image, we can calculate overall abundance of each species. The image below shows canopy map and cover estimates for a selection of species.
Canopy map of dominant species at Sage Hill determined from drone images (left) and barchart summarizing total cover by species (right).
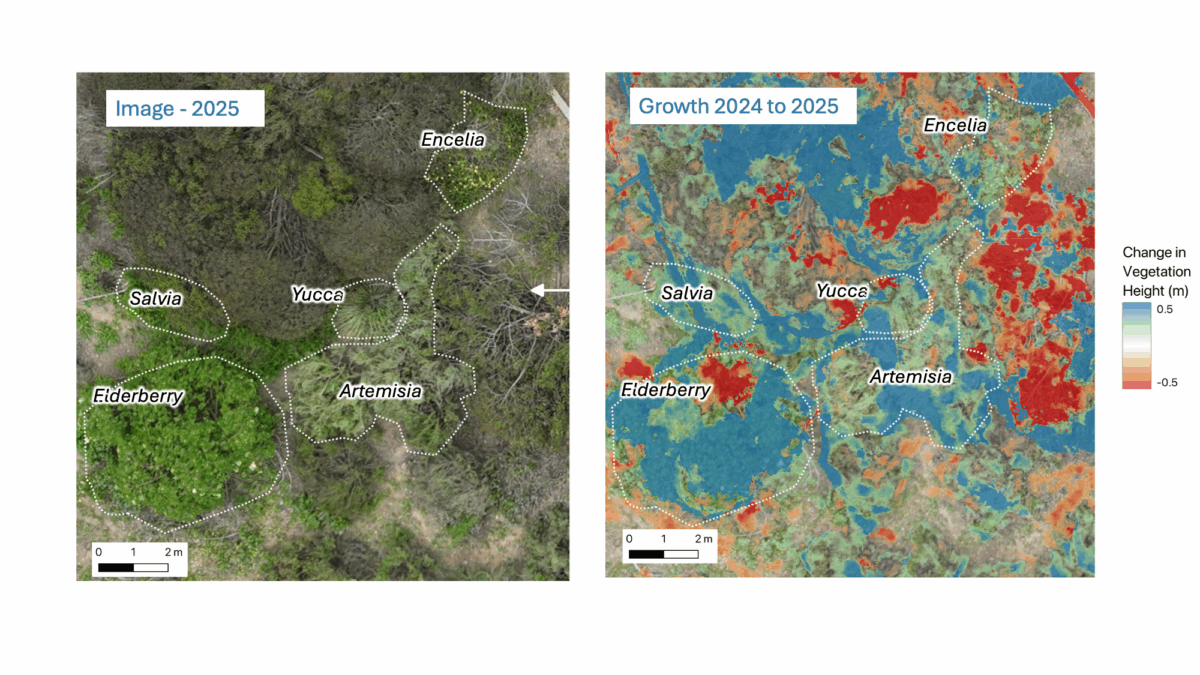
In addition to measuring the area of species, drone images can also be used to produce detailed three-dimensional images of the ground and vegetation surface. Comparing 3D surface heights across multiple years can allow us to calculate changes in vegetation height and measure the growth of individual plants as shown in the image below.
Drone image of Sage Hill vegetation (left) and false color image showing growth of plants in the same area (right). The false color image is created by comparing plant height from 2025 to height from a year earlier. Blue show areas where vegetation height increased, and red shows areas of where vegetation height decreased. The image combined with plant canopy maps can be used to derive species-specific measures of vegetation change–for instance the elderberry in the lower left increased in height over much of its canopy indicating growth.