Smartphone Locations Reveal Patterns of Cooling Center Use as a Heat Mitigation Strategy
Where does one go during a heatwave? 2022 IoES Practicum students track smartphones to find out.
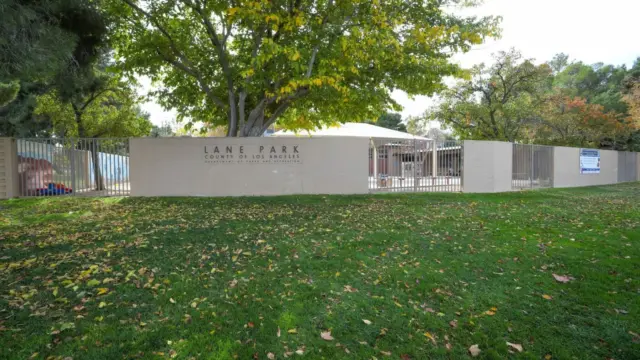
Warming projections of the Los Angeles area show an unequivocal increase in extreme heat. As the climate warms, the temperature in developed regions is compounded by the urban heat island effect. As a result, residents are especially vulnerable to extreme heat events, or heatwaves. Fortunately, Los Angeles (LA) County has cooling centers or sites that attempt to mitigate the harmful effects of extreme heat by providing proper air conditioning and relief from the sun. Formal cooling centers are facilities that are open to the public for relief from the heat, such as libraries and recreation centers. Figure 1 shows a map of formal county centers in LA. Informal cooling centers are open buildings or businesses that provide relief from the heat in addition to their primary function, such as shopping centers, movie theaters, and restaurants. The availability and accessibility of these facilities are especially important for socio-economically disadvantaged communities, who may not have access to private cooling systems—like air conditioning systems or fans—and are thus the most at-risk to heat related consequences.
Figure 1. Formal County Cooling Centers in Los Angeles (2017)
Our team piloted a novel methodology utilizing mobile phone location data to evaluate cooling center occupancy during twelve days from a two-month summer period in LA County. We found that occupancy during hot and baseline days did not exhibit a particular pattern, and no statistically significant differences existed between hot and baseline usage. We also discovered that users tend to stay longer in cooling centers on hot days. We did find higher duration of stay in cooling centers on hot days. In Figure 2, baseline occupancy decreases over the afternoon period, while hot occupancy stays more constant.
Figure 2. Average Occupancy of All Cooling Centers by Hot and Baseline Days.
Additionally, we investigated the Social Sensitivity Index (a score used by the county to identify tract vulnerability) of cooling centers and their users. Usage on hot days compared to baseline in high vulnerability tracks demonstrates that vulnerable people are seemingly going to the cooling centers during heatwaves. This data will be essential in supporting climate-resilient policy that can bolster protections for vulnerable communities.
Finally, we analyzed transportation accessibility to cooling centers. The percentage of visits to cooling centers within walking distance decreased on hot days compared to baseline across all cooling center types, suggesting that people may potentially drive to further cooling centers on hot days or just decide to stay at home. We found that for both hot and baseline days, cooling centers with closer transit stops saw higher visitation than cooling centers with less accessible public transportation stops. We hope that the County of Los Angeles Department of Public Health will be able to expand this pilot to include a larger dataset and identify suitable locations for future heat infrastructure projects.
Student Team: Trisha Nicole Bautista, Mari Bouwman, Liana Huang, Lily Lee, Jo Tarczynski, Ian Wahagheghe, Xinyi Zeng
Clients: Elizabeth Rhoades & Alison Frazzini; County of Los Angeles (Department of Public Health and County Chief Sustainability Office)
Faculty Advisor: Dr. Travis Longcore & Dr. Sahar Derakhshan, Institute of the Environment and Sustainability
This practicum project is supported by the Heat Resilient LA project at UCLA , which is funded by the UCLA Sustainable LA Grand Challenge. We thank them for access to the smartphone location data.
Related Publications
Related Article
Beating the heat in L.A.: County’s ‘informal’ cooling centers are used more than official ones
With climate change making heat waves longer and more severe, Los Angeles County has for several years provided cooling centers — many of which are in libraries, parks or other…
Project Type: Practicum Project
Year: 2022
Status: Completed