New book from UCLA urban sustainability experts: Q&A with Stephanie Pincetl
A quarter of all greenhouse gas emissions come from buildings in California — over 100 million tons per year. And while the state is a leader in setting ambitious climate…
A quarter of all greenhouse gas emissions come from buildings in California — over 100 million tons per year. And while the state is a leader in setting ambitious climate goals, those goals will be hard to meet without a detailed understanding of building energy use patterns and their drivers.
Data on energy consumption of individual buildings was held under regulatory lock and key by state utility agencies until a coalition of local governments, the Governor’s office under Jerry Brown, and academics, among whom Stephanie Pincetl played an important role, came together and gained access to it. She and her team then created UCLA’s Energy Atlas, an interactive website built with the largest set of publicly available energy data in the nation.
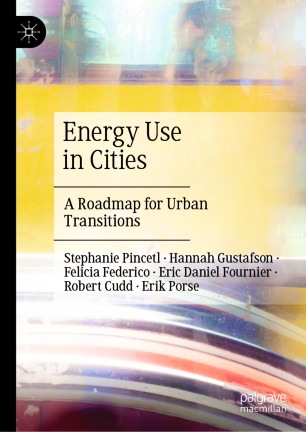
Pincetl is the founding director of the California Center for Sustainable Communities at UCLA and professor-in-residence at the UCLA Institute of the Environment and Sustainability. I recently spoke with her about her new book Energy Use in Cities: A Roadmap for Urban Transitions, which she co-wrote with researchers Hannah Gustafson, Felicia Federico, Eric Daniel Fournier, Robert Cudd and Erik Porse. The book uses California as an example to detail how to construct an energy data hub for socially conscious research, and how that can be used to help local governments and community-based organizations meet their sustainability goals.
How did you become interested in urban sustainability?
PINCETL: I’ve been interested in human interactions with the environment for a very long time. Cities are the concentration of human activities on the planet, and what we do in cities has enormous impacts on resource use and land use in other places, not just cities. Understanding city processes and our resource dependency seemed like a good place to begin to understand how we are changing the environment and at the same time creating a lot of inequality. As the discipline of urban studies developed over time, the concept of urban sustainability began to emerge.
How did the Energy Atlas project begin? What role did you play in creating it?
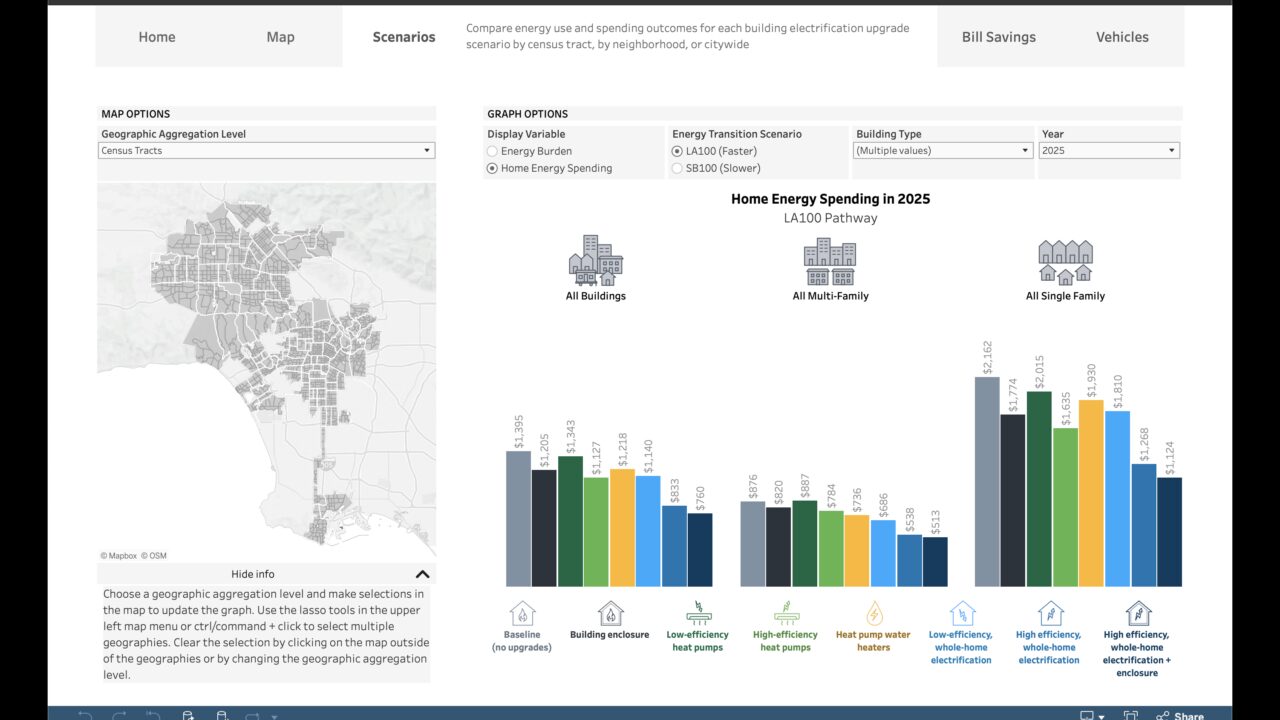
Over 10 years ago, I wanted to create a study to quantify and understand the urban metabolism of L.A. County. So what is “urban metabolism”? It includes all of the energy, resource and material flows into urban areas, how they’re used — where and by whom — and how the waste flows out. The first thing I did was look at building energy use: how much electricity, how much natural gas, was consumed on a building-by-building basis. I went to the energy commission, the state entity that plans for energy supplies into the future, and was told they didn’t have that information, though recently they have started to receive it. All they had were broad descriptions of total energy of electricity and natural gas by geographical area. I was in complete disbelief. It was difficult to evaluate the effectiveness of any energy incentive programs without more specific data. At the same time, I learned local governments were equally frustrated that they couldn’t get that kind of data from their utilities.
Working with a colleague at L.A. Department of Water and Power, I was able to get account-level, building-by-building data under a non-disclosure agreement and we began to construct maps to get more insight into what’s going on inside the urban fabric. Then you can match the data to things like socio-demographics, size of buildings, age of buildings or the location of buildings. That was the basis for the Energy Atlas.
Let’s talk about the book. What impact do you see the book having in shaping this framework that will help California reach its ambitious energy efficiency goals?
What the book is intended to do is to provide people with an understanding of the importance and the usefulness of building energy data. It provides policy makers, local nonprofits, governments and others the understanding of building energy use such that they can target energy efficiency investments. As we learned from our work the International Energy Agency, and the Atlas is seen as a best practice internationally for understanding building energy use. Everyone is interested in reducing building energy use. This is a tool that helps you do that. We’re trying to provide our experience so other places might be able to replicate something like this. To date, this is not happening anywhere else. The Energy Atlas includes Los Angeles, San Bernardino, Riverside, Ventura and Imperial counties — all of Edison territory and all of Southern California Gas territory. We’re building an Energy Atlas for the Bay Area, so soon we’ll have a counterpart there as well.
Are there any energy consumption facts the Energy Atlas has revealed that a normal person wouldn’t know about?
Houses have gotten bigger and bigger. You can implement energy conservation measures — double paned windows, insulation, and other similar measures — but the houses use more energy than their smaller counterparts because they are so much bigger. Wealthy areas in L.A. use ten times more energy per capita than poorer areas in L.A., even though houses in poorer neighborhoods are not as energy efficient.
Because low-income communities’ electricity usage is lower, they may have more capacity to be solar self-reliant, but there are all kinds of other impediments. The grid needs to be updated, the electric systems in the homes would need to be upgraded, they may need batteries, new roofs, and for renters it could be impossible to deploy local photovoltaic solar. So we’re trying to unpack all of those pieces on the basis of the atlas for the implications of moving to 100% electric energy in the home.
California is a leader in setting ambitious climate goals. How can building energy consumption information help reach these targets?
It can help in the reduction of the use of fossil fuels — of natural gas in particular. Burning natural gas creates air pollution and greenhouse gas emissions. If you move away from fossil fuels you create a double benefit: a short-term benefit of public health, a longer-term benefit on climate. That’s important. California has certainly been a climate leader, but it has done so through policy without a lot of data. We’re trying to provide that data to make policies more tailored and effective.
If you’re a sustainability minded individual in Los Angeles, what do you think the main takeaways from your book are?
This book has a number of purposes. One is the use of maps and data to teach students in science and data science classes. Then it has a policy side for folks who are interested in providing tools to target reductions in energy use. Finally, for those who might be interested in replicating the Atlas in their geographies, the book provides a guide on how to do so. There are many energy agencies and high-level energy planning organization for whom access to data is equally elusive. This gives them a proof of concept to go to various utilities or regulatory agencies to advocate for the usefulness of greater energy data transparency. It allows examining building energy use patterns across landscapes according to age, size, socio-demographics. You begin to be able to read patterns of wealth, where new buildings are and their sizes, and that gives you the knowledge to address sustainability issues in an efficient and equitable way.
MEET THE AUTHOR

RELATED ARTICLES
Heat is killing more Angelenos. UCLA is turning community health workers into a frontline of defense

PhD Candidate Spotlight: Rachel Sheinberg and the Future of Equitable Energy