UCLA’s Energy Atlas expands to provide consumption data for most of Southern California
Online tool updated to include solar capacity, as California aims for 100% renewable energy
Amid the drumbeat of apocalyptic environmental headlines, a team of UCLA researchers is laying meticulous groundwork for sustainable cities and towns.
Led by UCLA professor-in-residence Stephanie Pincetl, the California Center for Sustainable Communities produces comprehensive research on urban systems so policymakers, businesses and residents can make better-informed decisions to address environmental problems. In December, they created a roadmap for adapting L.A. County’s water supply system to account for climate change.
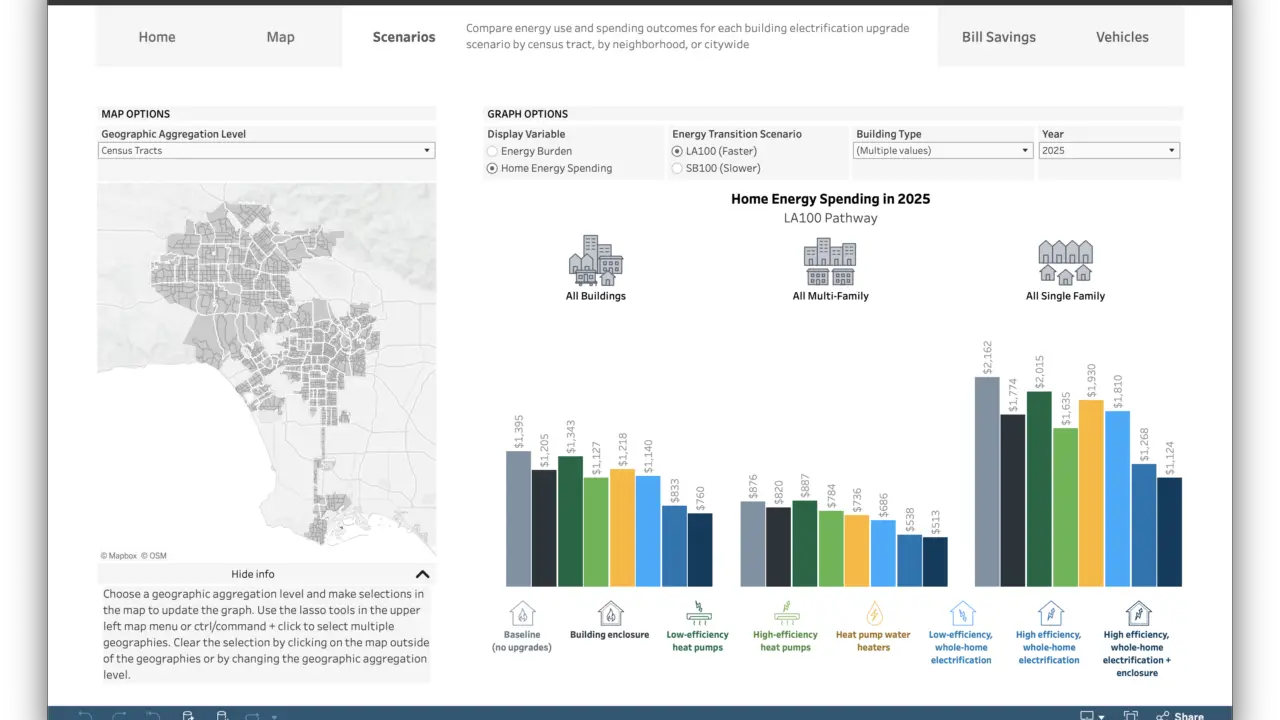
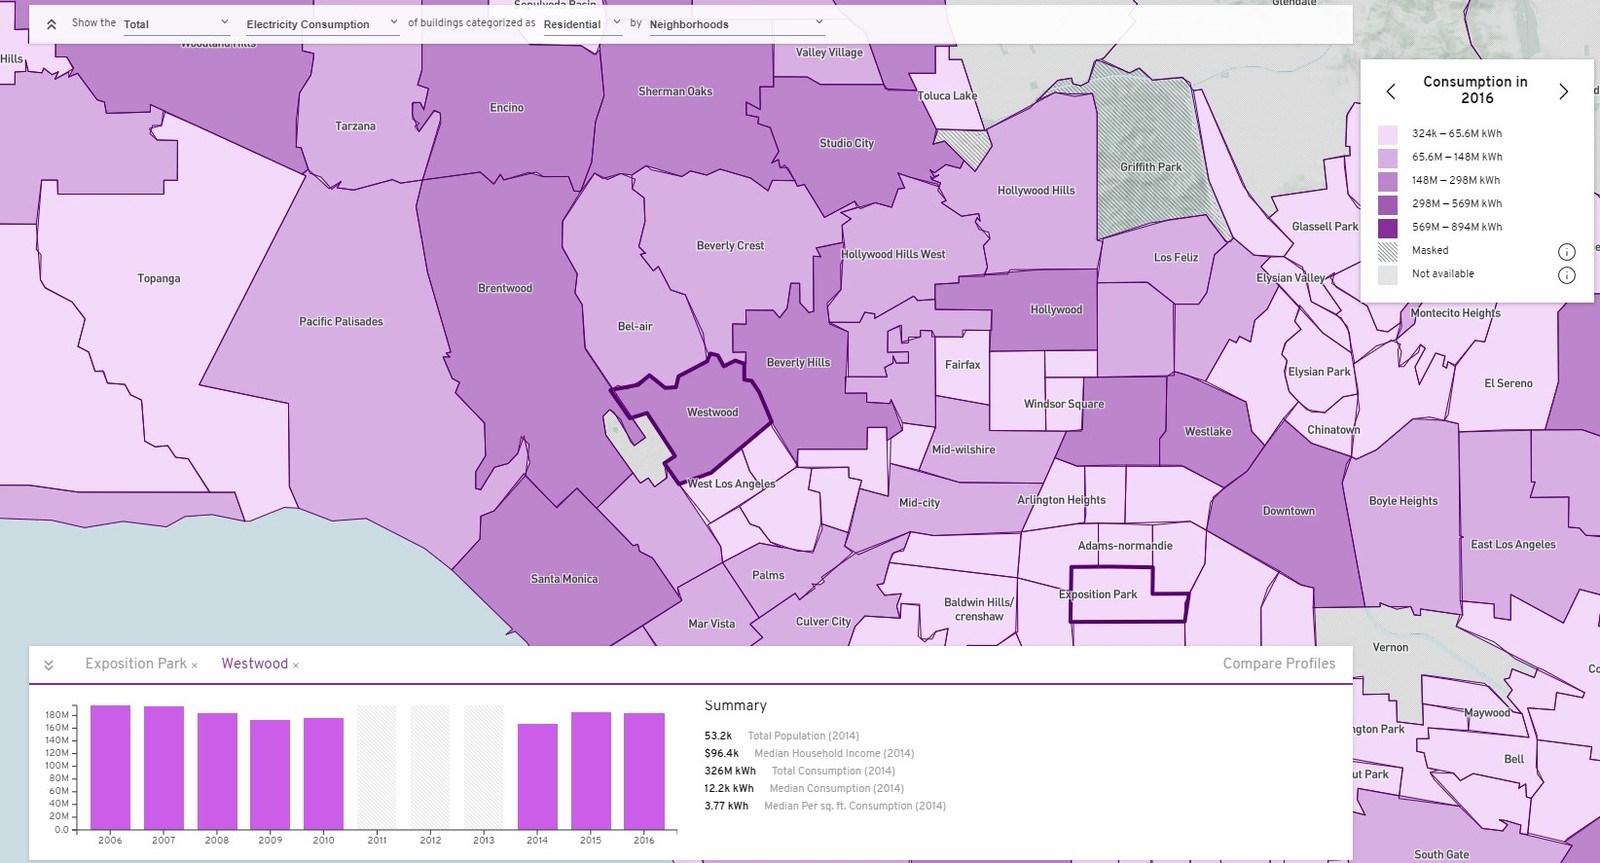
Today the group released Energy Atlas 2.0 — a free online tool that combines energy use data with information about building size, age and type, location, demographics and more into an interactive map. Users can then sort by that information to find out, for example, how much energy is used by buildings more than 30 years old, by residential versus industrial buildings, or by neighborhood, city and county.
The new energy atlas expands on its predecessor, which was released in 2015, by going from cataloging only Los Angeles County to now including most of Southern California (except San Diego County and some small public utilities). The updated version also adds six more years of data, through 2016, and includes climate data and information about buildings’ capacity for solar power in Los Angeles County.
The atlas enables cities, towns and municipalities to develop energy efficiency plans that more precisely target where improvements can do the most good. Examples of ways it could be used include:
- to implement rooftop solar schemes in communities where they will be most effective — like a residential community with lots of available roof space and lower power demands
- to place electric vehicle chargers where they’ll have the greatest impact
- to improve programs that address energy efficiency, by helping identify leaky older residential buildings that need retrofitting to prevent heat or air conditioning from escaping
The data has also been used to identify vulnerabilities in the grid that could lead to outages — a problem expected to increase in the coming decades with higher temperatures.
The stakes are high, both locally and globally. Buildings are responsible for 40% of carbon emissions in cities, and the United Nations projects that 68% of the world population will live in urban areas by 2050.
Pincetl and her team, who are currently writing a book about the Energy Atlas, spent more than a decade working with California utilities and government agencies to access the massive amounts of information the project requires.
“We probably have a majority of the energy use data for the state,” other than San Diego County and Pacific Gas & Electric territory in Northern California, Pincetl said. “Local governments statewide are increasingly interested in this tool.”
Researchers are still exploring the compiled data, but one stark takeaway is how unequal energy usage can be. Residents in Malibu use 10 times more electricity per capita than people living in South L.A.
UCLA’s lead data analyst for the Energy Atlas, Hannah Gustafson, spent the past six years compiling data and standardizing it. Because of privacy laws, energy use information for individual customers must be hidden or masked. Despite that limitation, the atlas offers a deeper understanding of energy systems than any other publicly available tool. Prior to its launch, only utility companies had access to usage data at this level.
“We do this so local governments can get a better sense of what’s going on at ground level in their communities,” Gustafson said.
UCLA researchers used the atlas to conduct research for the California Energy Commission and to inform plans to help get disadvantaged communities to net zero energy — using as much energy as they generate, or less. Historically, energy grid upgrades focused on new housing or urban development, which are built disproportionately in affluent communities.
“Billions of dollars are spent every year — ratepayer money, so that’s money out of your pocket and my pocket — on energy efficiency programs,” Gustafson said. “We can use this data to ensure accountability and that these programs are targeted in a way that will achieve the most reductions.”
California has set ambitious goals to do its part to curb climate change, including reducing greenhouse gas emissions to 40% below 1990 levels by 2030, requiring solar panels on new homes up to three stories by 2020, and transitioning to a fully renewable energy grid by 2045. The updated Energy Atlas will help create a path to achieve those goals in a way that benefits all.
“One of the biggest issues facing the transition to renewables is to ensure that it is done in a just way, so that disadvantaged communities can participate equally,” Pincetl said. “Our work aims to increase the potential that everyone will be benefited by this shift to a post-carbon energy system.”
Top Image: Los Angeles at night from Griffith Park. | Photo by Angelin Song/Flickr.
MEET THE AUTHOR

RELATED ARTICLES
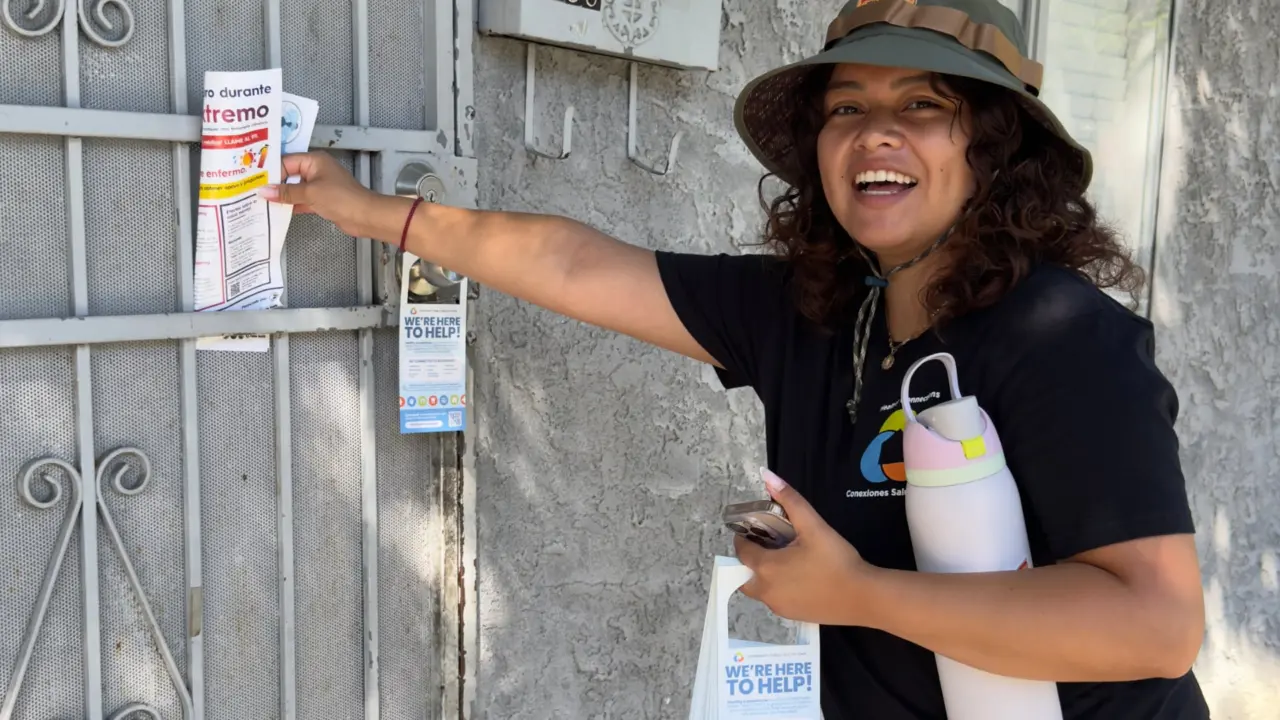
Heat is killing more Angelenos. UCLA is turning community health workers into a frontline of defense

PhD Candidate Spotlight: Rachel Sheinberg and the Future of Equitable Energy